by Sean
There’s a category of “win” in marketing that exists only because nobody bothered to draw a benchmark line on the chart. You add visits year on year. The arrow points up. Someone screenshots it for a board deck. Everybody nods. Nobody looks at what the rest of the market did in the same window, because if you don’t draw that line, the chart can’t betray you.
Click here to access the latest Sports Nutrition market report.
Now, UK sports nutrition grew 19.00% in the year to April 2026. The dataset covers 434 brands. That is the line. Anything below it is a brand losing share while its internal dashboard celebrates growth. Anything above it is a brand actually winning.
Holland and Barrett is a useful example. Not because they did anything wrong this year. Because they are the cleanest case in the dataset of a brand pulling in the largest absolute gain in the category and still going backwards.
The numbers: biggest traffic gain, biggest share loss
The ugly numbers, anchored to the Salience Index tables.
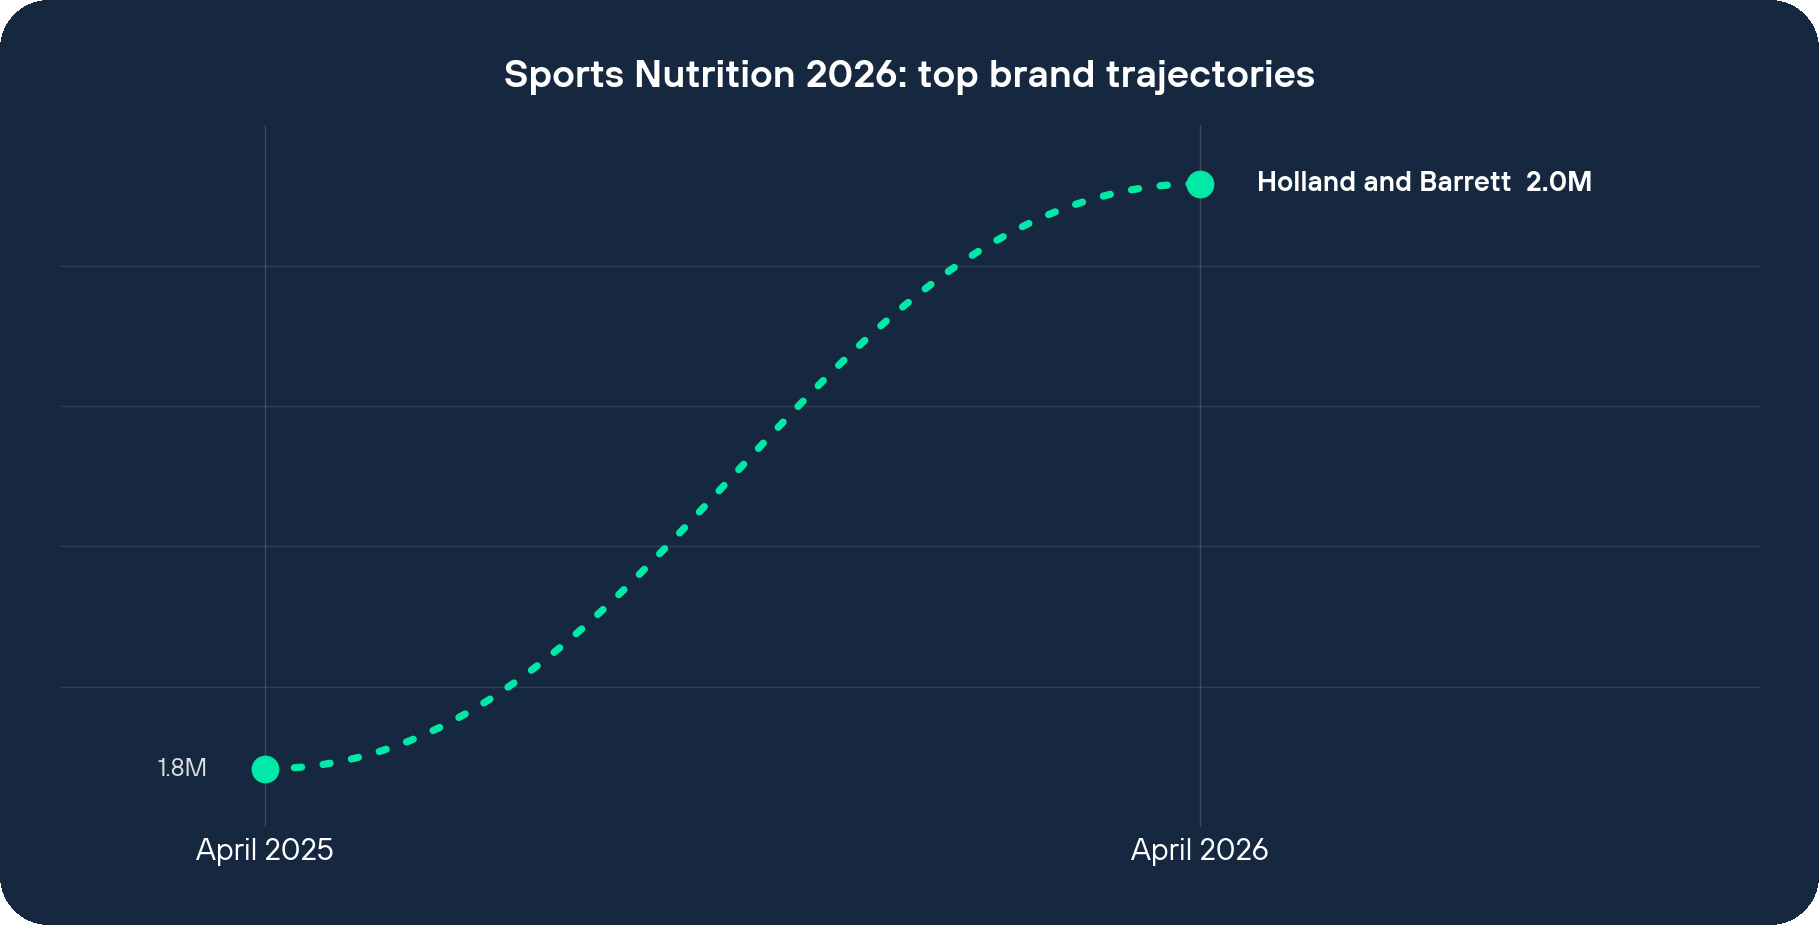
H&B added 207,425 visits between April 2025 and April 2026, moving from 1,777,117 to 1,984,542. That is the biggest absolute traffic gain of any UK sports nutrition site in the dataset. Bigger than MyProtein. Bigger than Huel. Bigger than every challenger brand that you’d assume was eating their lunch.
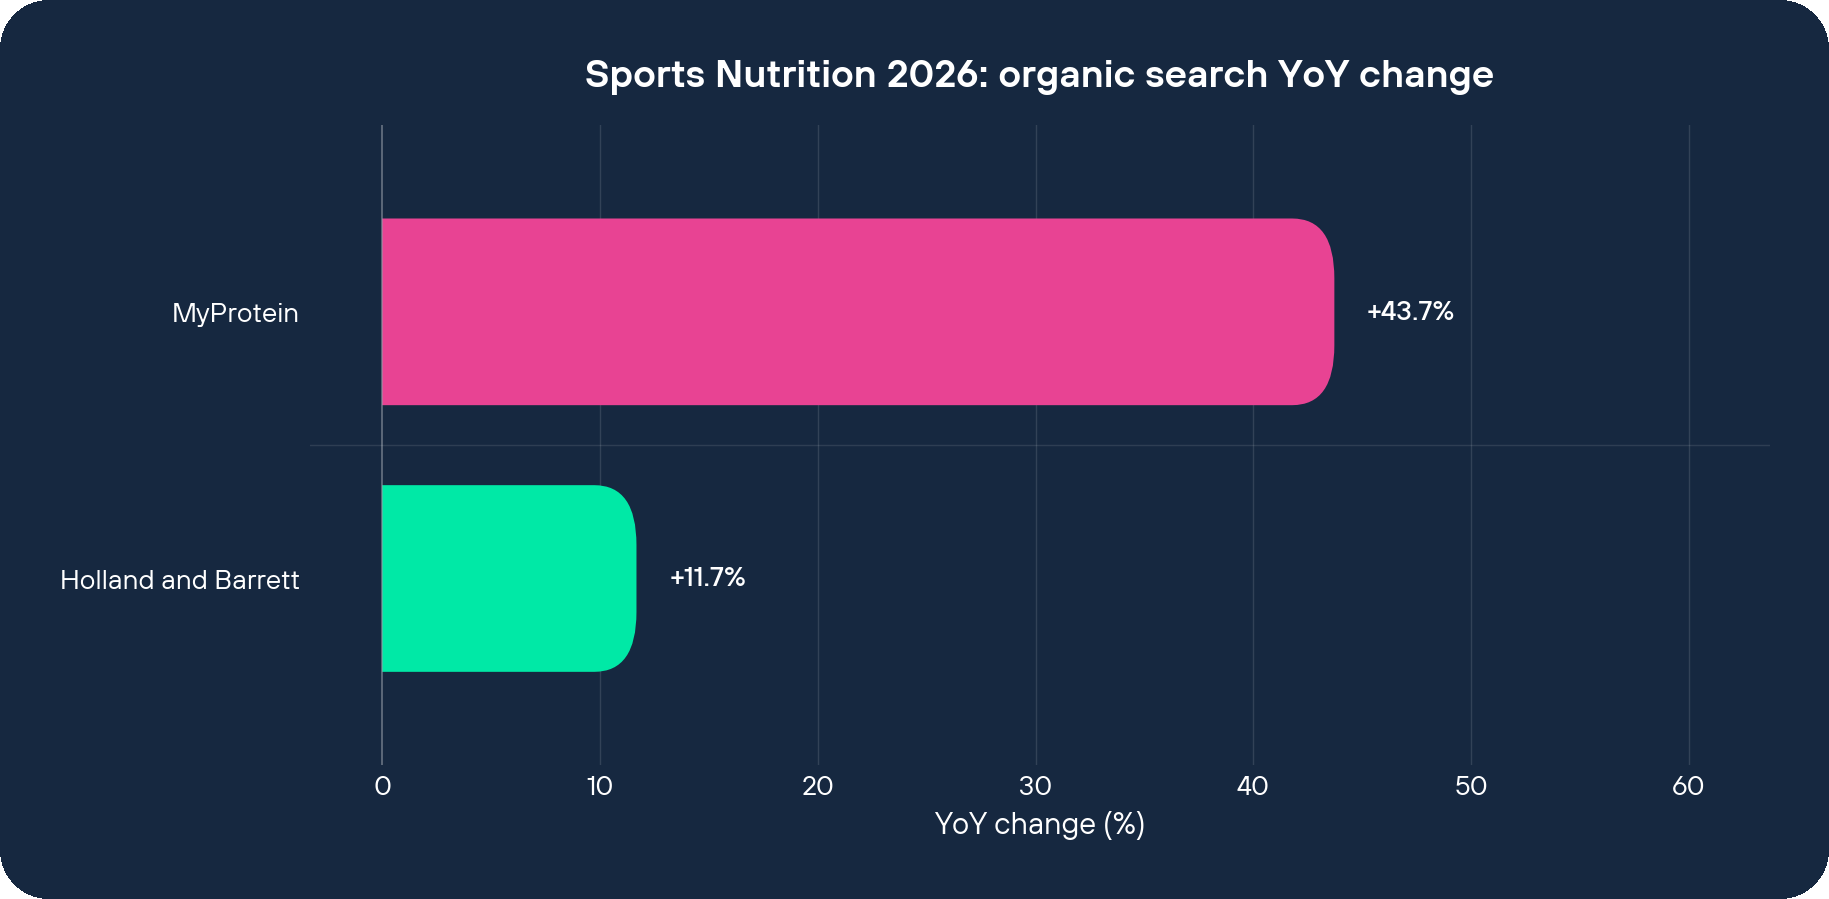
Then the second number. Year on year, H&B grew 11.67%. The market grew 19.00%. The gap is 7.33 percentage points of category share, ceded, while the dashboard arrow stayed green.
Third number. MyProtein, the brand sitting directly above them in the absolute-gain table, grew 43.72% in the same window. That is 24.72 points ahead of the market. The growth-rate gap between MyProtein and H&B is 32.05 points. They are not in the same race.
Fourth number, because reach is worth checking. H&B sits at Brand Reach Score rank 2 of 50, with 823,000 monthly brand searches. The brand pull is enormous. The brand pull is precisely what is hiding the share loss.
Holland and Barrett’s deliberate wellness-retailer bet
H&B has made a deliberate, defensible, expensive bet. They have decided to be the wellness retailer online, the way they are on the high street.
Not the sports nutrition retailer. Not the creatine destination. Not the place you go to compare whey protein per-gram cost. The wellness retailer.
You can see the bet in the homepage headline: The UK’s Leading Health & Wellness Store. That isn’t a category capture statement. It’s a brand-territory statement. It tells the wellness shopper you’re home and tells the protein shopper nothing at all.
The bet protects the brand. It keeps the high-street footprint, the brand recall, and 22,194 site-wide reviews at 4.4 stars all pointing in one direction. It stops the brand fragmenting into a hundred sub-category fights. There’s a reason for that. Heritage retailers can survive being broad because the brand does the discovery work for them.
The bet costs them sports nutrition. The buyer who types best creatine UK into Google in 2026 is not looking for a wellness retailer. They are looking for a sports nutrition site. And the +19.00% growth tells you there are a lot more of them this year than last. H&B is choosing, structurally, not to be in that conversation.
Two homepages compared: Holland and Barrett vs MyProtein
Two homepages. Same category. Different decade.
On H&B, the wellness positioning runs the page. The UK’s Leading Health & Wellness Store sits at the top. Sports nutrition is in there, but it sits inside a wellness merchandising structure organised the way the physical stores are. The page is designed to absorb brand-search traffic and route it into wellness journeys, not to convert sports-nutrition search intent into protein purchases.
Now flip that on its head. MyProtein‘s header reads Fuel Your Ambition with the No.1 Online Sports Nutrition Brand. Category, not territory. Sports nutrition, not wellness.
The nav under it is six tiles. Protein. Creatine. Activewear. Bars, Food and Snacks. Vitamins. Pre-Workout. Every primary nav slot is a category-level query that the +19.00% market is searching for. The first thing the page does is route the buyer into the search-intent they arrived with.
The promo stack does the conversion job. UP TO 50% OFF SALE. Plus an extra 10% off £35 spend, or an extra 15% off £65 spend, using code MORE. The thresholds push basket size up. The discount header pulls the price-sensitive buyer in.
Above the fold: 211,340 reviews, 4.4 average. Earn £15 credit via referral. Free standard delivery on £50 spend. Every signal is engineered for the sports nutrition buyer in 2026, not the wellness shopper in 2010.
And the product tile. Impact Whey Protein, 29,511 reviews on a single SKU, £27.99, the promo overlay stamped on every listing. That isn’t a homepage. That’s a conversion mechanism wearing a homepage.
Sure, H&B has 22,194 reviews site-wide against MyProtein’s 211,340. The volume gap is real. But the bigger gap is the architecture. MyProtein’s homepage answers what am I buying in two clicks. H&B’s homepage answers what is this shop first, and asks you to navigate from there. The second posture is fine if the brand does the work. It stops being fine when category-level search volume grows 19.00% and your homepage doesn’t speak its language.
Stop reporting absolute traffic, report vs-market share
If H&B is the cleanest example of “biggest absolute gain, biggest share loss,” everyone with a heritage brand and a green-arrow dashboard needs to redo their reporting.
Stop reporting absolute traffic deltas in isolation. They are noise. Report vs-market deltas. If the market grew 19.00% and you grew 11.67%, write minus 7.33 points of share at the top of the deck and let the room react to that number first.
Now imagine the reverse version of that meeting. You are the head of digital at H&B, and instead of presenting +207,425 visits as the headline you present minus 7.33 points of category share, because we are not competing for category-level search intent. That meeting is harder. That meeting gets you better questions.
I’ve put myself on a tangent, but stay with me, because this is where the organisational truth shows up. Nobody gets fired for presenting +207,425 visits. The norm protects the absolute number. The very fact that benchmarking against market growth exposes the team to a worse-sounding story is exactly why benchmarking against market growth doesn’t happen. Anyway. Back to the point.
The job changes. The job of a category leader in 2026 is to be the answer to category-level queries, not the answer to brand-name queries. Brand-name traffic is rented from your own recall. Category traffic is earned from how your site is structured. MyProtein has structured for category traffic. H&B has structured for brand recall. The +19.00% market is a category-traffic market.
What stops being first-class: brand territory messaging on the homepage. What becomes first-class: category nav, search-intent capture, conversion mechanics that match the buyer’s query. If you sell sports nutrition and your homepage doesn’t say Protein, Creatine, Pre-Workout above the fold, the +19.00% market is walking past your front door.
The caveats: what the dataset cannot measure
A caveat the dataset cannot argue with. H&B’s high-street estate, mailing list and brand recall do work no SEO tool fully measures. Some of those 207,425 added visits will convert at much higher rates than MyProtein’s blended traffic. The 11.67% growth rate is not a death sentence. It is a share-loss signal, in one category, in one year.
But here is the meeting line: in a market growing 19.00%, adding 207,425 visits while growing 11.67% is not a win, it is a controlled retreat with a green arrow on top.