 by Michael
Last week we looked at what an AI mention is actually worth.
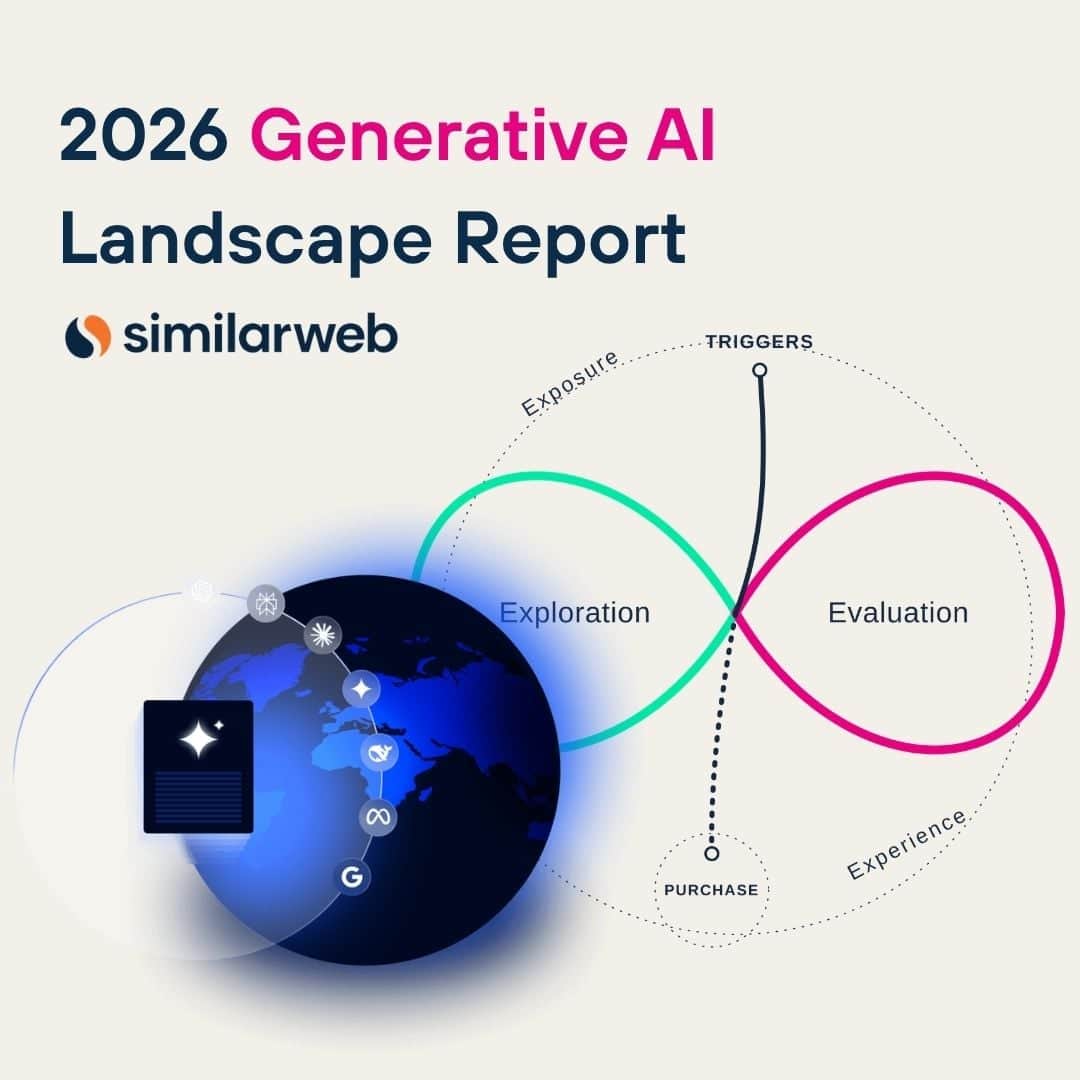
Similarweb has now published the full report that data came from, all 38 slides of it. One of those slides should change how you read every AI visibility number you have been handed this year.
It is not the one about market share.
On this page
01How big AI search actually is
02One assistant is no longer the market
03The number that should worry you
04Where AI cites, and where the traffic lands
05Being named is worth more to some brands than others
06What actually holds up
TL;DR
Generative AI took 9.5 billion average monthly web visits in the year to May 2026, growing 57% on unique visitors while search grew 2%. It is also still around a fifth the size of search. ChatGPT’s share of that traffic fell from roughly 76% to roughly 52%. But the number that matters is on slide 28: on 7 May 2026, one ChatGPT update moved the share of AI referrals landing on homepages from around 25% to nearly 60% in three weeks. No brand did anything to cause it. If your AI visibility measurement is built on referral behaviour, you are not tracking a market. You are tracking somebody else’s release notes.
How big AI search actually is
The headline numbers in Similarweb’s 2026 Generative AI Landscape are genuinely large. Generative AI platforms took 9.5 billion average monthly web visits between June 2025 and May 2026, up 70% year on year, across 655 million unique visitors, up 57% from 418 million. App downloads went from 2.8 billion to 4.4 billion.
Set against the rest of the web, that growth rate is in a different class. Search grew 2% over the same period. Social and ecommerce both grew 7%. News and publisher sites fell 5%, the only major category to shrink.
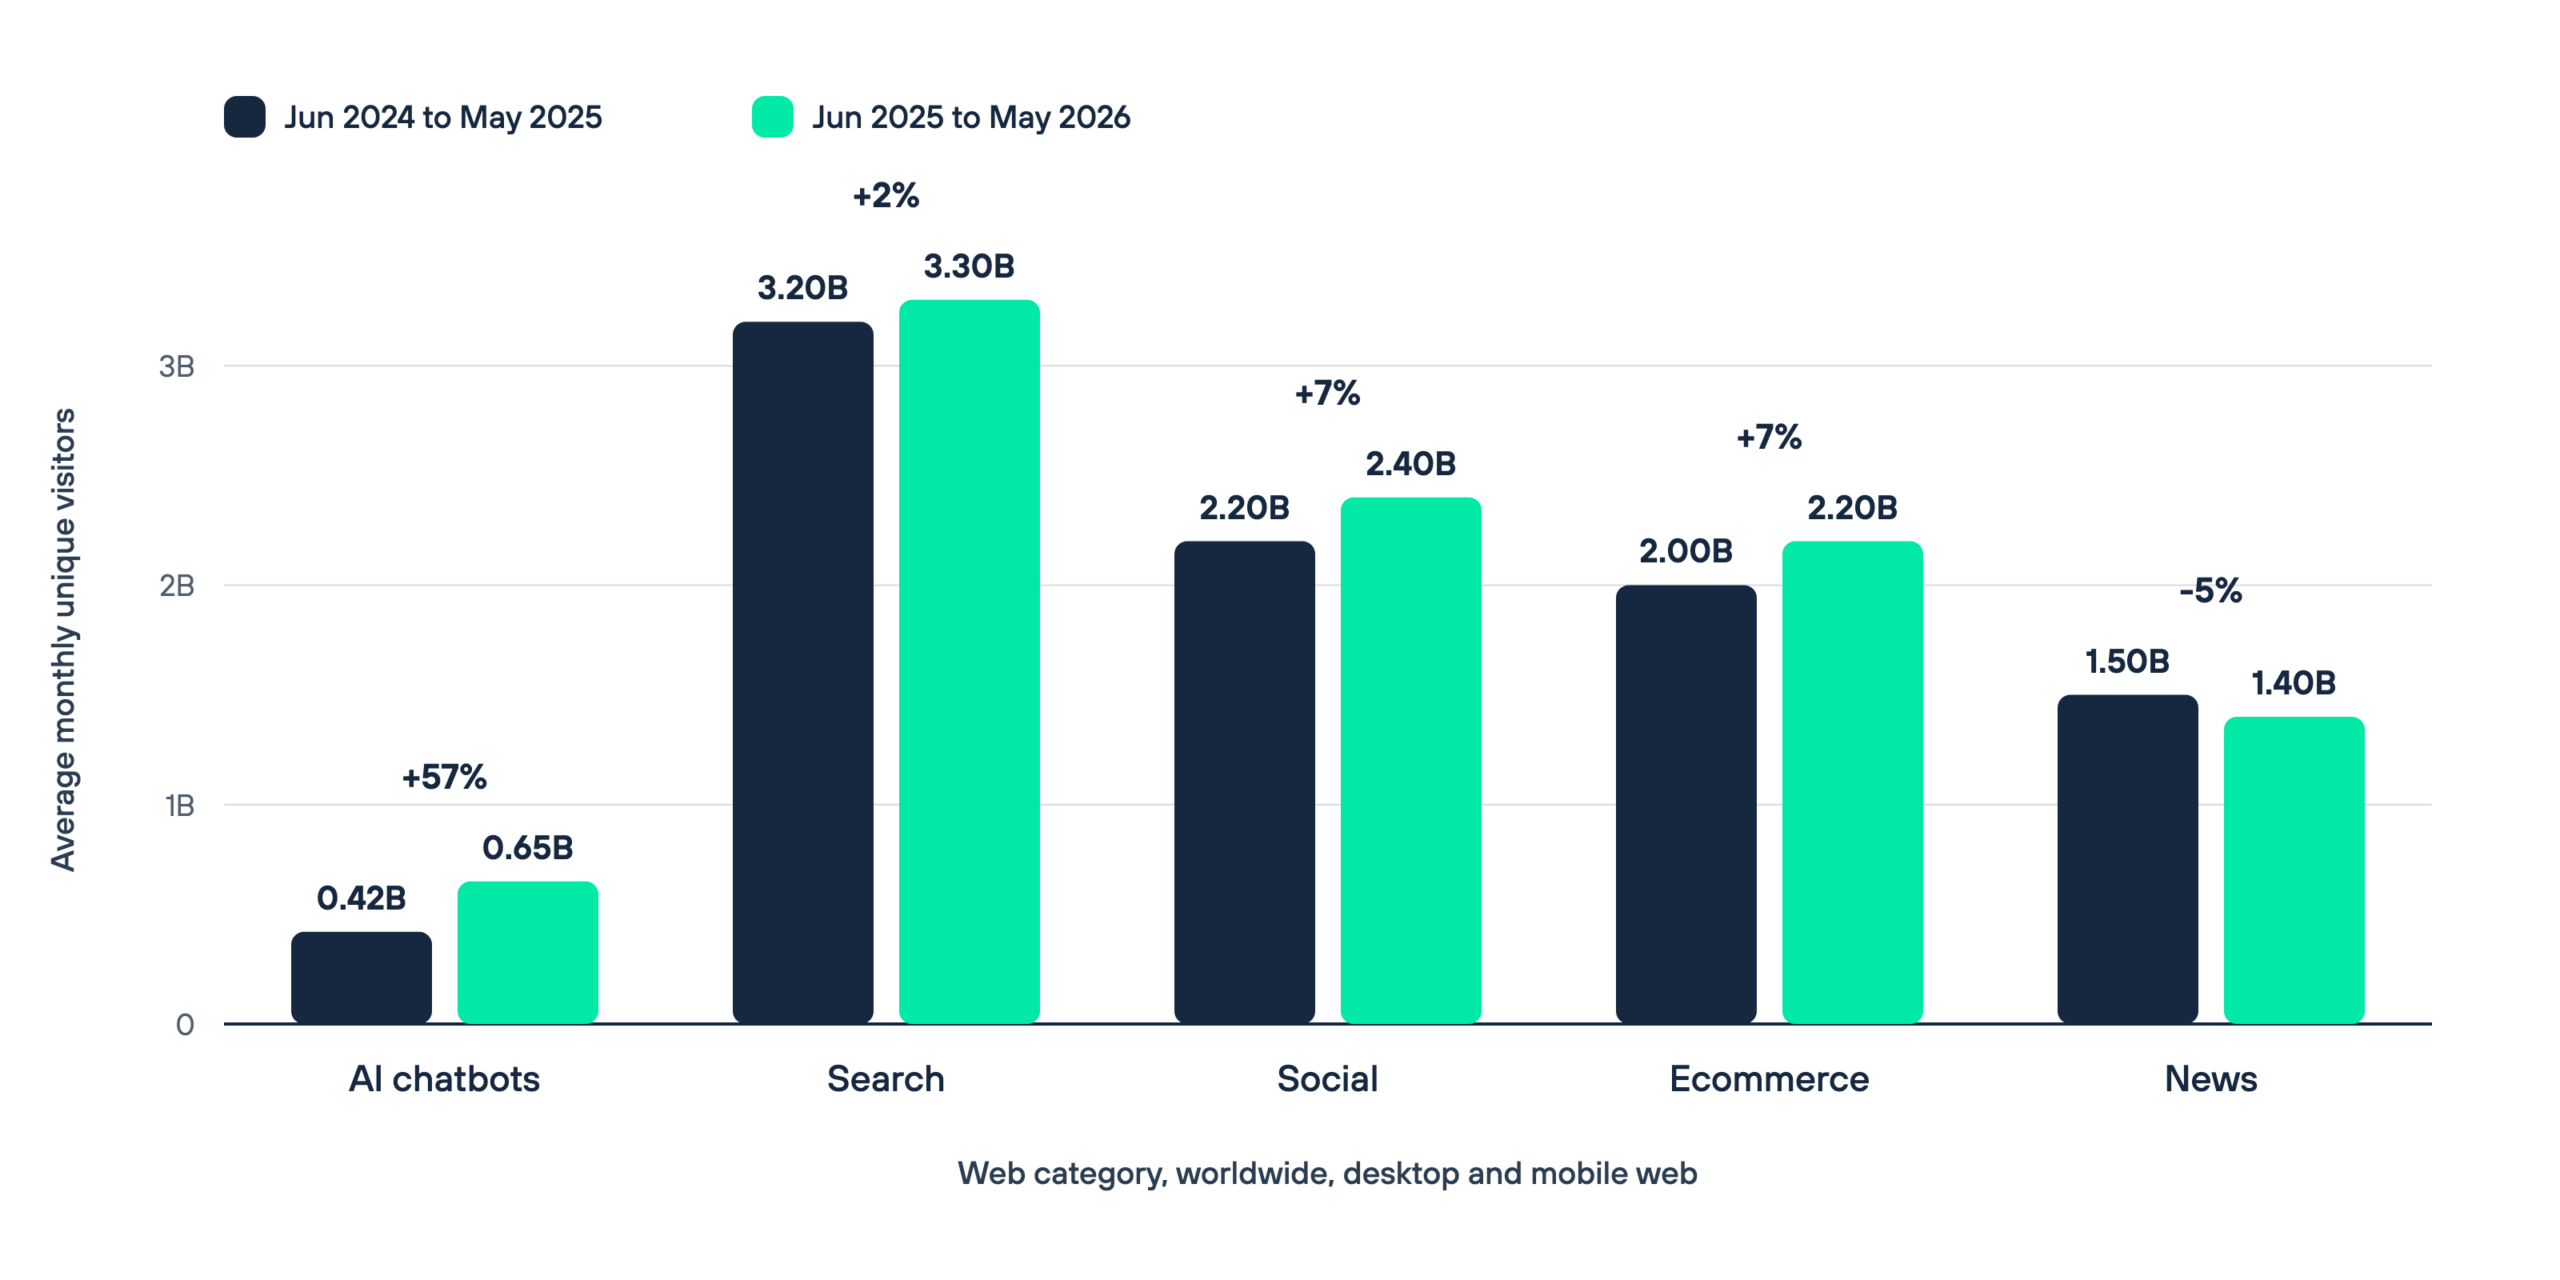
It is worth holding both halves of that chart in view at once.
655m
average monthly unique visitors to AI chatbots, against 3.3 billion for search. The fastest growing category on the web is still around a fifth the size of the one it is supposed to be replacing
Anyone who forgets the first half of that is going to be slow. Anyone who forgets the second half is going to overcorrect, and overcorrecting is expensive in a channel this young.
Our position has not changed. This is redistribution, not destruction.
One assistant is no longer the market
For most of the last two years, measuring AI visibility has meant measuring ChatGPT. That approximation is expiring.
ChatGPT’s share of generative AI web visits has gone from around 76% in June 2025 to around 52% in May 2026. It remains comfortably the largest platform, and on US app users it is still roughly 50 million against Gemini’s 29.5 million. But the growth is happening elsewhere. Measured on US monthly active app users, May 2026 against June 2025, Meta AI grew 435% and Claude grew 349%. Grok grew 117% and Perplexity grew 94%. ChatGPT grew 87%, which would be a headline in any other market. Gemini grew 31%. Microsoft 365 Copilot fell 31% and DeepSeek fell 23%.
The audiences are separating too, and they are not the same people. 494 million people use ChatGPT, 310 million use Gemini and 86 million use Claude, but only 29 million use all three. Meanwhile 95% of ChatGPT users are still using Google, unchanged since September 2025.
More usefully for anyone deciding where to compete, the platforms attract genuinely different audiences. Indexed against Google’s visitors at 100, Claude users are 25 times more likely to visit university sites and three times more likely to visit programming and business services sites. ChatGPT users over-index on restaurants and delivery at 2.4x, health at 2.3x and fashion at 2.1x. Gemini users over-index on graphics and web design at 4.8x.
Which assistant matters to you depends on what you sell.
The number that should worry you
Here is the finding we have not seen anyone else pull out of this report.
On 7 May 2026, OpenAI shipped a search update. In the three weeks after it, the share of ChatGPT referral traffic landing on homepages rather than deeper pages went from around 25% to nearly 60%. Referral volume jumped at the same time.
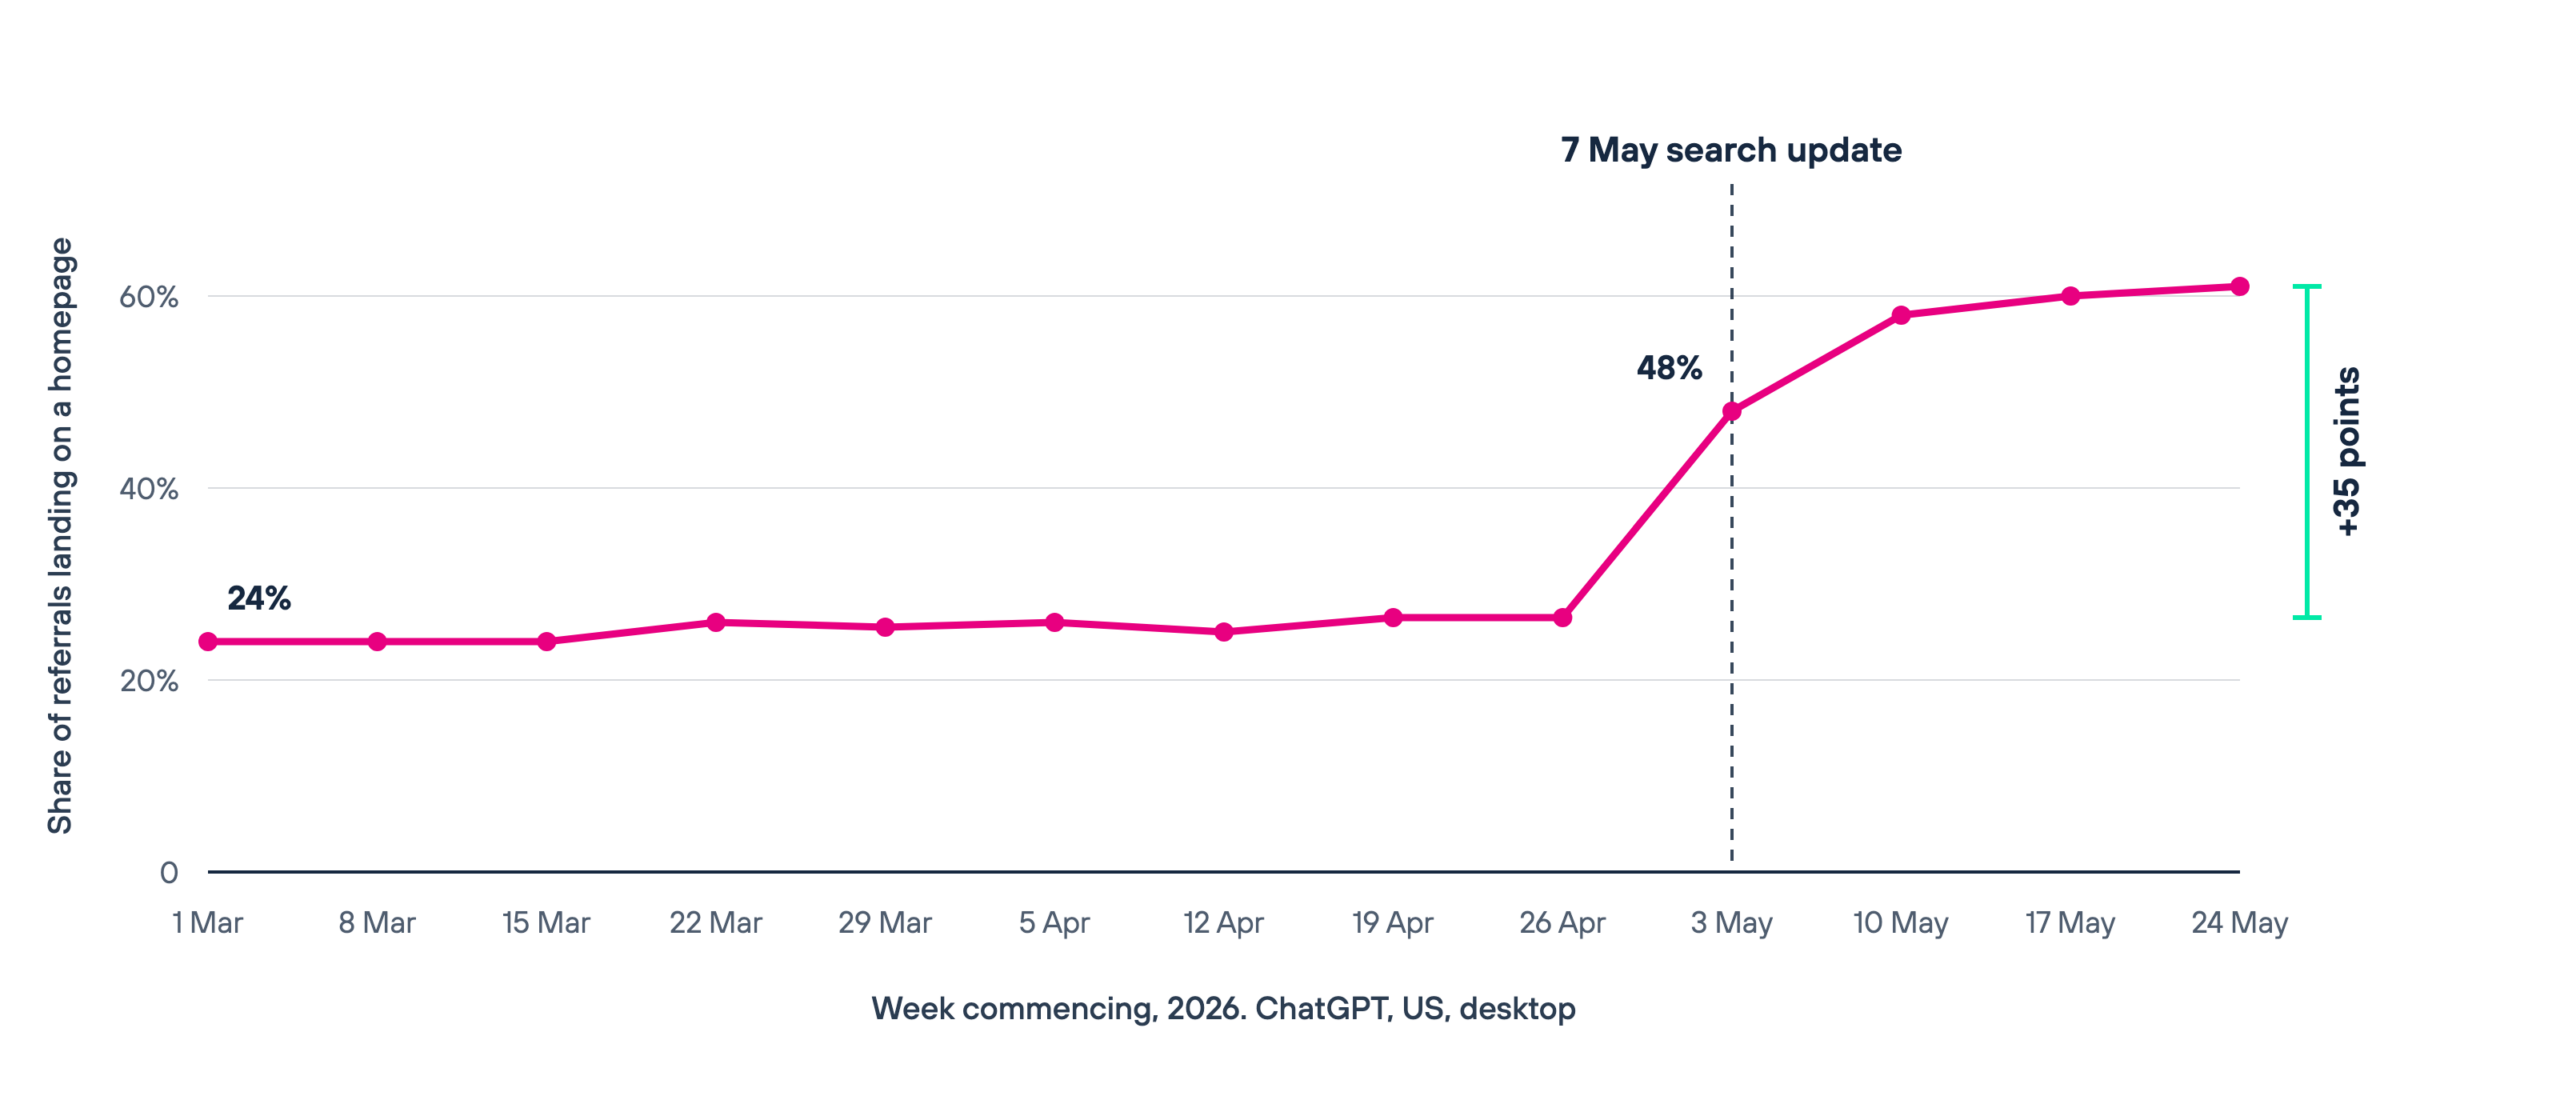
Look at the shape of it. Nine consecutive weeks sitting between 24% and 26%, then a cliff.
No brand published anything, earned any authority or changed any strategy to produce that. A product team shipped on a Thursday.
35 points
the move in one of the headline metrics of AI search, in three weeks, caused entirely by somebody else’s product release
Sit with that, because it is the whole problem.
Most of what the market currently sells as AI visibility measurement is built on referral behaviour: where the clicks land, how deep they go, what they do next. That behaviour is not a property of your brand.
It is a property of somebody else’s interface, and it is being rewritten every few weeks by people who have never heard of you.
It gets harder still, because the measurable part is shrinking as a share of the real thing. Similarweb say so in their own footnote: the report excludes API usage, desktop applications and in-app AI features. The surfaces growing fastest are precisely the ones that hand you nothing. Meta AI has passed a billion monthly users inside Meta’s own apps. Google is pushing more journeys into AI Overviews and AI Mode. Amazon’s Alexa for Shopping has multiplied product page views several times over in a year, with CeraVe, Revlon and e.l.f. at the top of the list of brands receiving that traffic.
Embedded AI does not send you a referrer. It sends you a customer, or it sends one to a competitor.
Where AI cites, and where the traffic lands
The report also shows the problem from the other direction, and this is the cleanest chart in it.
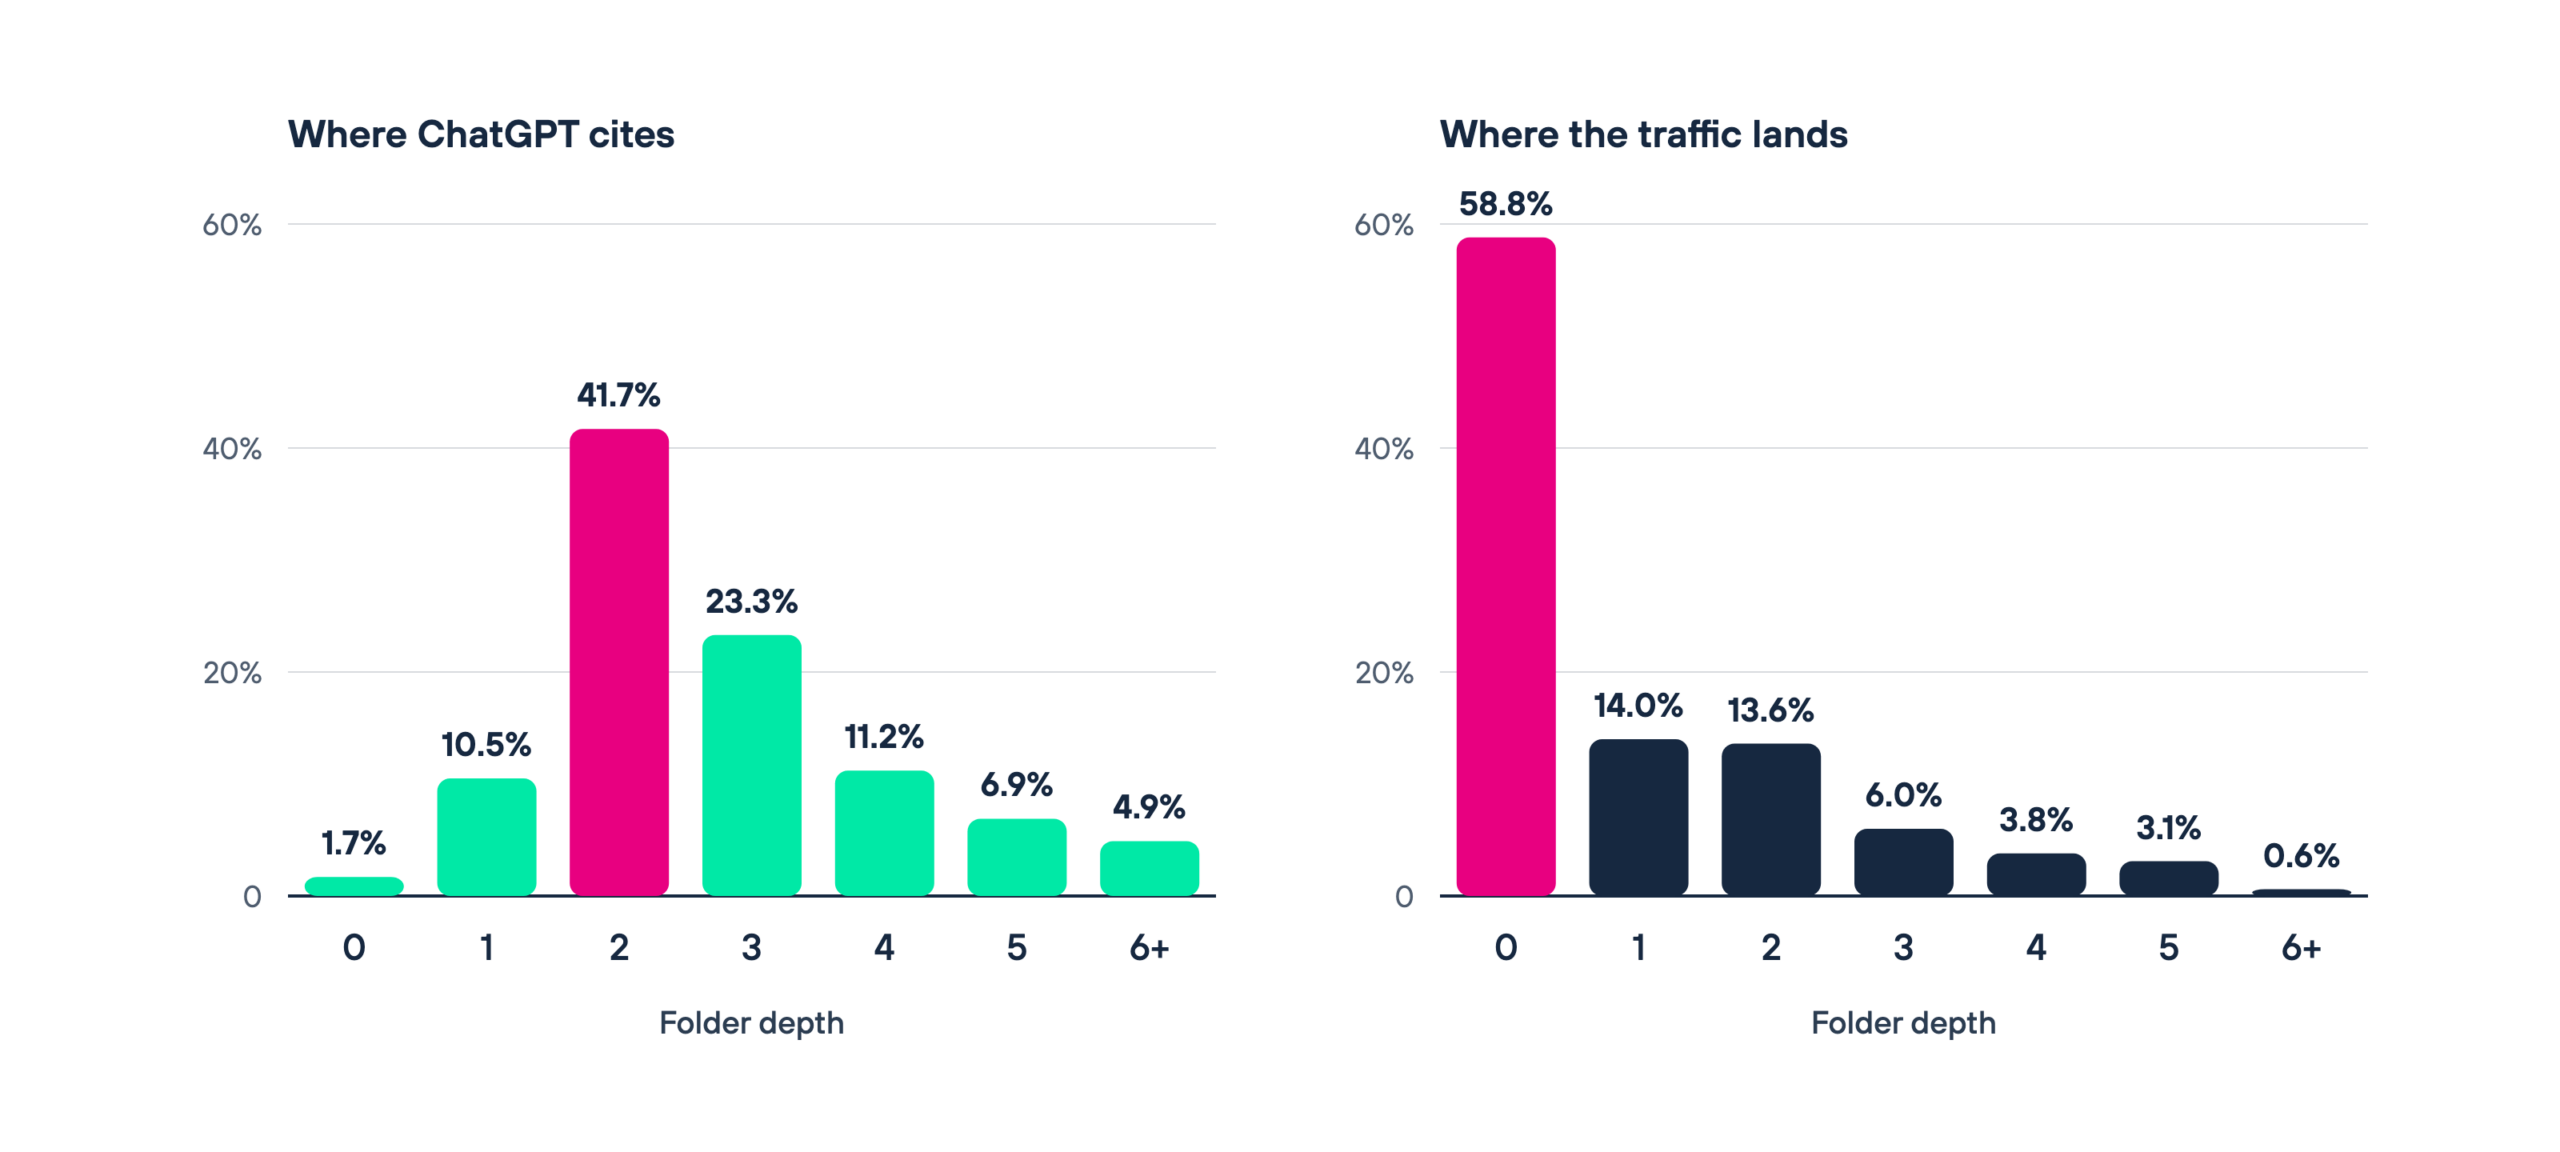
65% of cited URLs sit two or three folders deep, with depth two alone accounting for 41.7% of citations. 58.8% of referral traffic lands on a homepage. As Aleyda Solis of Orainti puts it in the report, cited pages are the evidence and traffic pages are the entrance, and they should be assessed separately. Strengthen the deep pages that influence the answer, and make sure the top level pages taking the clicks are ready to convert.
All true. Also unstable.
That 58.8% was 25% in March. The distribution you are optimising against has a shelf life.
The wider context is that AI is reaching for the live web far more often than it used to. The share of ChatGPT answers containing citations has risen more than fivefold in under a year, to 6.8% overall, 13.5% in retail and 22.6% in travel. There is more to compete for, and the rules of the competition are being rewritten while you compete.
Being named is worth more to some brands than others
Last week’s piece covered the recommendation data, which turns out to be one slide of this same report. Reading the full set of pairs is more instructive than reading the average.
Similarweb tested six brands across finance, travel and beauty, measuring the share of users who visited each brand when AI recommended it against when AI recommended its rival. Comparing each brand against itself:
- Capital One: 3.1% when American Express was recommended, 14.2% when it was. A multiple of 4.6.
- Skyscanner: 3.4% when Kayak was recommended, 9.5% when it was. A multiple of 2.8.
- Ulta: 3.3% when Sephora was recommended, 7.6% when it was. A multiple of 2.3.
- American Express: 3.8% when Capital One was recommended, 7.2% when it was. A multiple of 1.9.
- Sephora: 4.6% when Ulta was recommended, 7.9% when it was. A multiple of 1.7.
- Kayak: 7.6% when Skyscanner was recommended, 12.0% when it was. A multiple of 1.6.
Similarweb summarise this as two to four times. Their own data runs wider than their summary, and the spread is the more useful finding.
1.6x to 4.6x
what being named in an AI recommendation is worth, depending entirely on which two brands are in the comparison
What being named is worth to you is specific to the competitors you are being compared against, in the category you actually compete in. A single visibility score cannot carry that, and any tool selling you one is selling you an average.
What actually holds up
The uncomfortable part is that none of this is really an AI problem.
Lily Ray of Amsive makes the mechanical case in the report. Every major AI search product runs on retrieval, which means live retrieval depends on positioning well in the underlying search index. If your organic visibility dips, your AI visibility follows. She also names the pattern of brands who worked this out backwards, accelerated content production to chase AI search, damaged their SEO doing it, and now face a steeper climb in both than if they had never bothered.
That is the entire GEO shortcut industry described in one paragraph, by somebody with no reason to be kind about it.
So what survives when the ground keeps moving? Four things, and none of them is a score.

Position against named competitors in your category, rather than presence in the abstract. The pair is the unit of measurement, not the brand.
Branded search and direct treated as AI outcomes, not as separate channels. Last week’s study put 56% of AI influenced visits arriving through search rather than a traceable referral, and that share rises as AI gets embedded.
Citations and traffic assessed separately, because they answer different questions. Deep pages earn the evidence. Top level pages take the click and have to convert it.
A re-baselining habit. In a market where one platform grew 349%, two shrank, and a single release moved homepage share by 35 points inside a quarter, any figure older than a quarter is decoration.
Similarweb land in much the same place. Their closing section argues the fundamentals matter more than ever, and that measurement is the thing which has to change, connecting visibility to branded demand and revenue rather than to rankings alone.
Rand Fishkin of SparkToro puts the historical version best in the report: this is a near replica of how advertisers measured billboards, TV and radio last century, using lift in store visits rather than a click to trace. Influence is clearly happening. What has to change is how we measure it.
One last detail, because it cuts against the panic. ChatGPT ads now appear in 26% of US chats, up from 14% a month earlier. Two thirds of them land after the second prompt, once the assistant knows what the user wants. The click through rate is 0.50%, and two thirds of users carry on chatting afterwards. Even the people building the ad product are getting influence without a click.
This is the problem the new version of the Salience Index is built for: visibility measured across platforms rather than one, weighted by where your audience actually is, relative to the competitors you are genuinely compared against, and joined up with the downstream demand that never shows as an AI referral. It re-baselines, because the market makes us.
We open the waiting list next week, and some of the people on it will get beta access before general release.
In the meantime, do the one thing anyway. Take whatever AI visibility figure your team reported last quarter, and ask what has changed on the platform since it was measured. If nobody knows, you are not tracking a market.
You are tracking somebody else’s release notes.
That’s all. Stay human 💜
Sources: Similarweb, 2026 Generative AI Landscape: The Evolution of AI Search (data: worldwide and US, web and app, June 2025 to May 2026; ad data US desktop to June 2026; audience affinity October 2024 to September 2025). Further figures from Similarweb’s AI search statistics. Recommendation data covered previously in The Downstream Impact of AI Visibility. Commentary via SparkToro. The homepage referral chart is redrawn from slide 28; weekly values are read from Similarweb’s chart, endpoints as stated in their copy.