by Dave
Updated July 2020
In modern search marketing, Google is seemingly tweaking its algorithm on a daily basis. But how can you determine what happened, when, and how it affected your site?
Luckily, there are a host of tools out there that can give you detailed insights as to what changed in the Google algorithm and how it may have affected your site and the search space surrounding it.
Related – History of Major Google Algorithm Updates
One of the most significant tools is Moz’s ‘weather report’ tool, Mozcast. Mozcast uses a weather system detailing how active the algorithm has been in the last five and thirty days based on how hot ‘the weather’ (Google’s algorithm) is that day.
Another tool that has earned some deserved attention is Algoroo. Algoroo does not operate in a weather system format; however, it does offer similar insights into how the Google algorithm has changed recently and delivers it in a straightforward and easy-to-understand way.
Therefore, this post will compare and contrast the two devices and judge which tool will be best equipped to fit into your search marketing toolkit.
Round 1 – Initial Thoughts
Mozcast’s weather system is an extremely creative way to show the differing algorithm points. However, it can be a little confusing and ‘too busy’ for beginners, with many aspects demanding your attention.
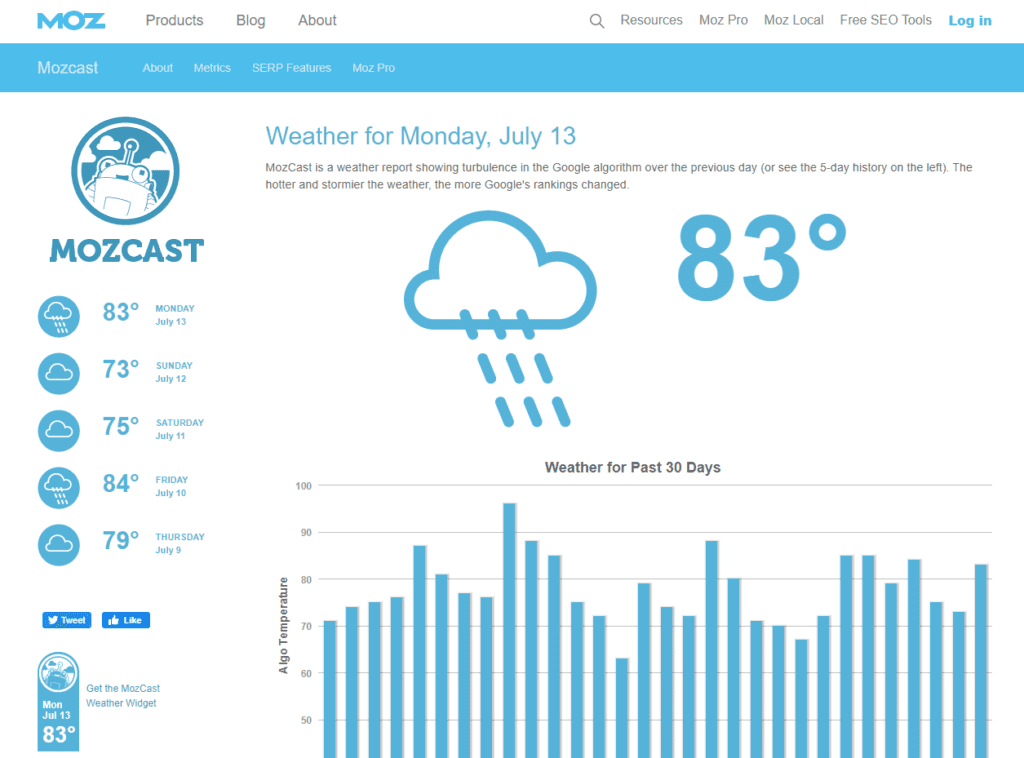
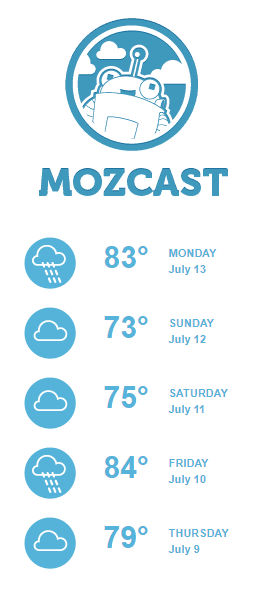
The layout features the ‘weather’ for today, the last five days weather results, weather for the last thirty days, and different tabs explaining the metrics and features:
The lack of context around what you are seeing here can be a little confusing for novice search marketers. Is hot bad? What is a good temperature? etc.
The layout, too is a little overwhelming, with various data points above the fold, perhaps placing the information vertically beneath one another could encourage users to scroll down the page and digest it more easily.
Algoroo, on the other hand, offers a much cleaner display with the important data front and centre.
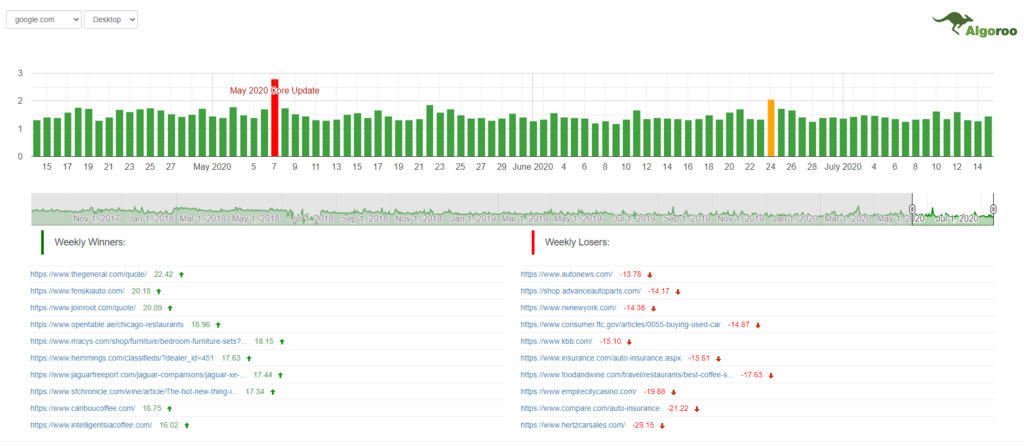
In addition, weekly winner and loser data is displayed below the bar chart to see the top level who had a positive or negative algorithmic week.
The graph also visually shows where there have been spikes in algorithm activity by changing the colours on the chart from green to orange or red. The red bars are helpfully labelled with confirmed algorithm updates.
Algoroo has nice little touches like the chart indicating the date on the X-axis of the graph, something Mozcast fails to show on their graph.
These differences makes the Algoroo tool instantly a lot easier to interpret the data from a top level.
Algoroo also offers a much wider data set, allowing you to look at algorithm activity from the previous 3 years, whereas Mozcast only offers data from 90 days ago.
This is a close first round, but the winner is: Algoroo
Round 2 – Speed and efficiency
With any tool that requires consistently fresh data and information, both of these tools need to be hyper-fast to keep your attention and immediately give you the data you need.

According to Mozcast, their data is updated “every 24 hours” and they “track a hand-picked set of 1,000 keywords and grab the top 10 Google organic results“. The keywords are reportedly “tracked at roughly the same time every day from the same location“. This gives Mozcast an extremely efficient way or drawing and comparing the data to the previous day.
For example, if they were to draw the data from different times of the day then the activity may be skewed and a full understanding would not be available.
Algoroo currently has no information on the site for when it pulls its data and how fast it achieves this. One assumes that the data is also pulled on a 24-hour basis as it obviously is updated each day. However, having no evidence of when the data is generated, and under what circumstances, unlike Mozcast, Algoroo loses this round.
Based on the more detailed data, the winner is: Mozcast
Round 3 – Insights
Playing around with both tools for only a few minutes is enough to see that Mozcast has the superior insights and analysis available when you know where to look.
There are multiple tools and graphs that show different perspectives and angles of the data, whereas Algoroo only shows the basics on their homepage.
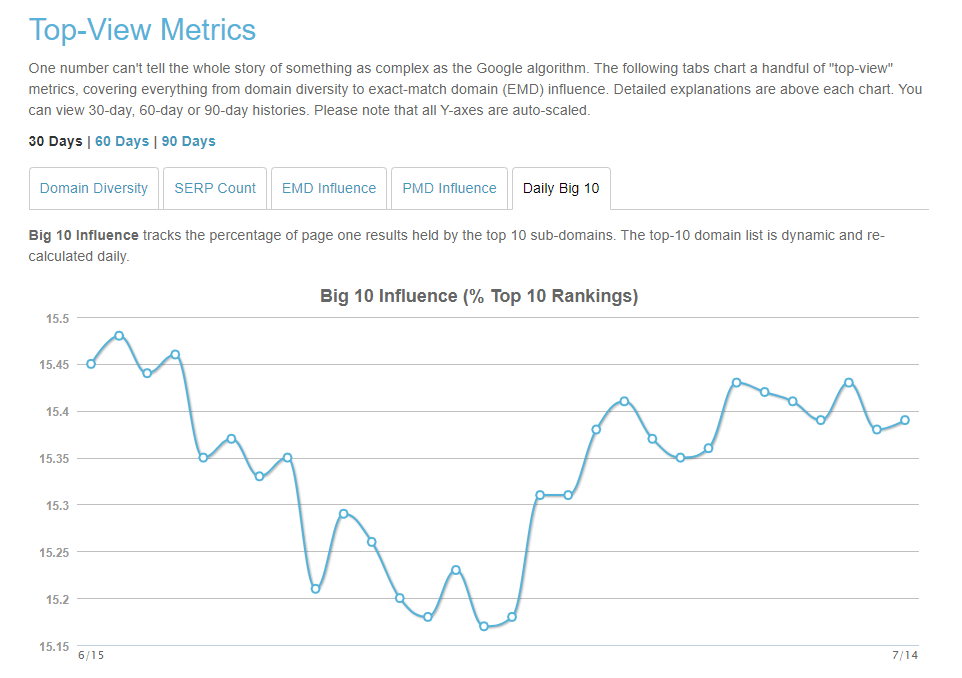
Quite rightly Moz highlights that “one number can’t tell the whole story of something as complex as the Google algorithm” and subsequently shows a plethora of graphs to try and understand as much of the algorithm activity as possible.
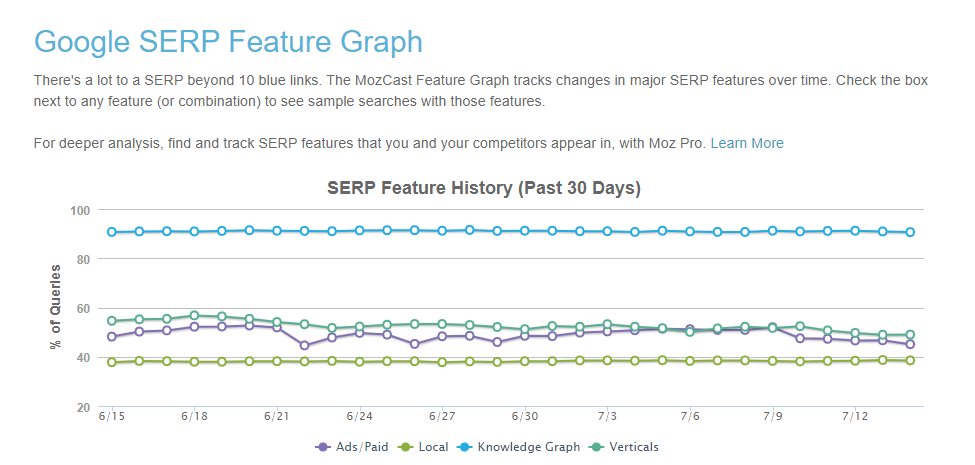
The Google SERP Feature Graph on Mozcast is excellent at showing the past 30 days of search result feature history:
Additionally, Mozcast boasts analysis on domain diversity, SERP count, EMD influence, PMD influence and even the daily big 10 influential sites:
Algoroo, meanwhile, only has the one bar chart on the single page. No contest really.
There is only one winner in this round: Mozcast.
You May Like – Why every SEO should use Screaming Frog
Round 4 – Analysing the data
Now we come to the most important part about both of these tools, the accuracy of the data.
Both sites update regularly and it is safe to assume that they have different ways to calculate Google’s algorithm activity. So let’s review a date that spiked the tools to see if they show the same or different insights.
For this face-off, I looked at the Mozcast spike on the 22nd of June 2020:
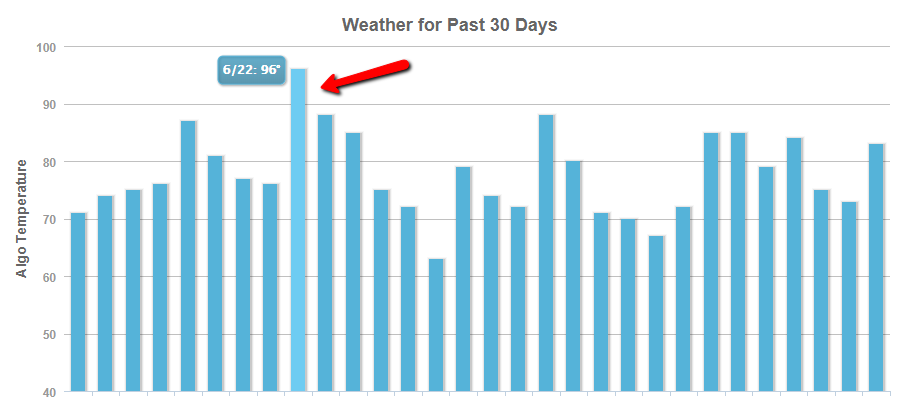
This is a pretty big increase on this day, so you would expect to see a similar reaction on Algoroo.
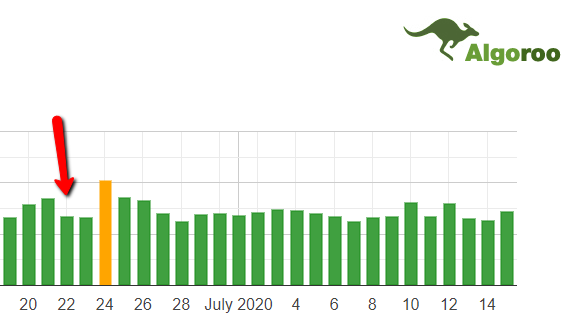
Interestingly, when I compared this spike with the same date on Algoroo, their bar was one of the lowest volumes over the last 30 days:
Doing a little more digging on this date, you can see the major SEO publications confirm this algorithm activity:

Source – Marie Haynes Consulting

Source – Search Engine Roundtable
It is extremely interesting that Algoroo didn’t mark this activity on their tool. Can this data really be trusted if a competitor tool and the industry at large is discussing activity, but you aren’t?
Round winner: Mozcast
And the winner is…
Mozcast! (3 – 1)
A close fought battle between two very respected and efficient tools, with both have their positives and negatives.
Moz offers a lot of deeper insights, yet the layout of the tools is a lot less straightforward when compared to Algoroo.
The most significant swinging point was the data available, which is the most important thing when looking at these tools.
The fact that Algoroo didn’t label the 22nd June 2020 as significant, when the rest of the industry did, was pretty damaging to their chances here.
If I had to choose between the two, I wouldn’t. Instead, I would use both, as you can never have too many insightful tools as a search marketer. Plus it is always recommended to verify data with another source in order to validate and confirm your first impressions.
Need more SEO help? See what we can do.