Need more value from search? Book a free discovery call 📞
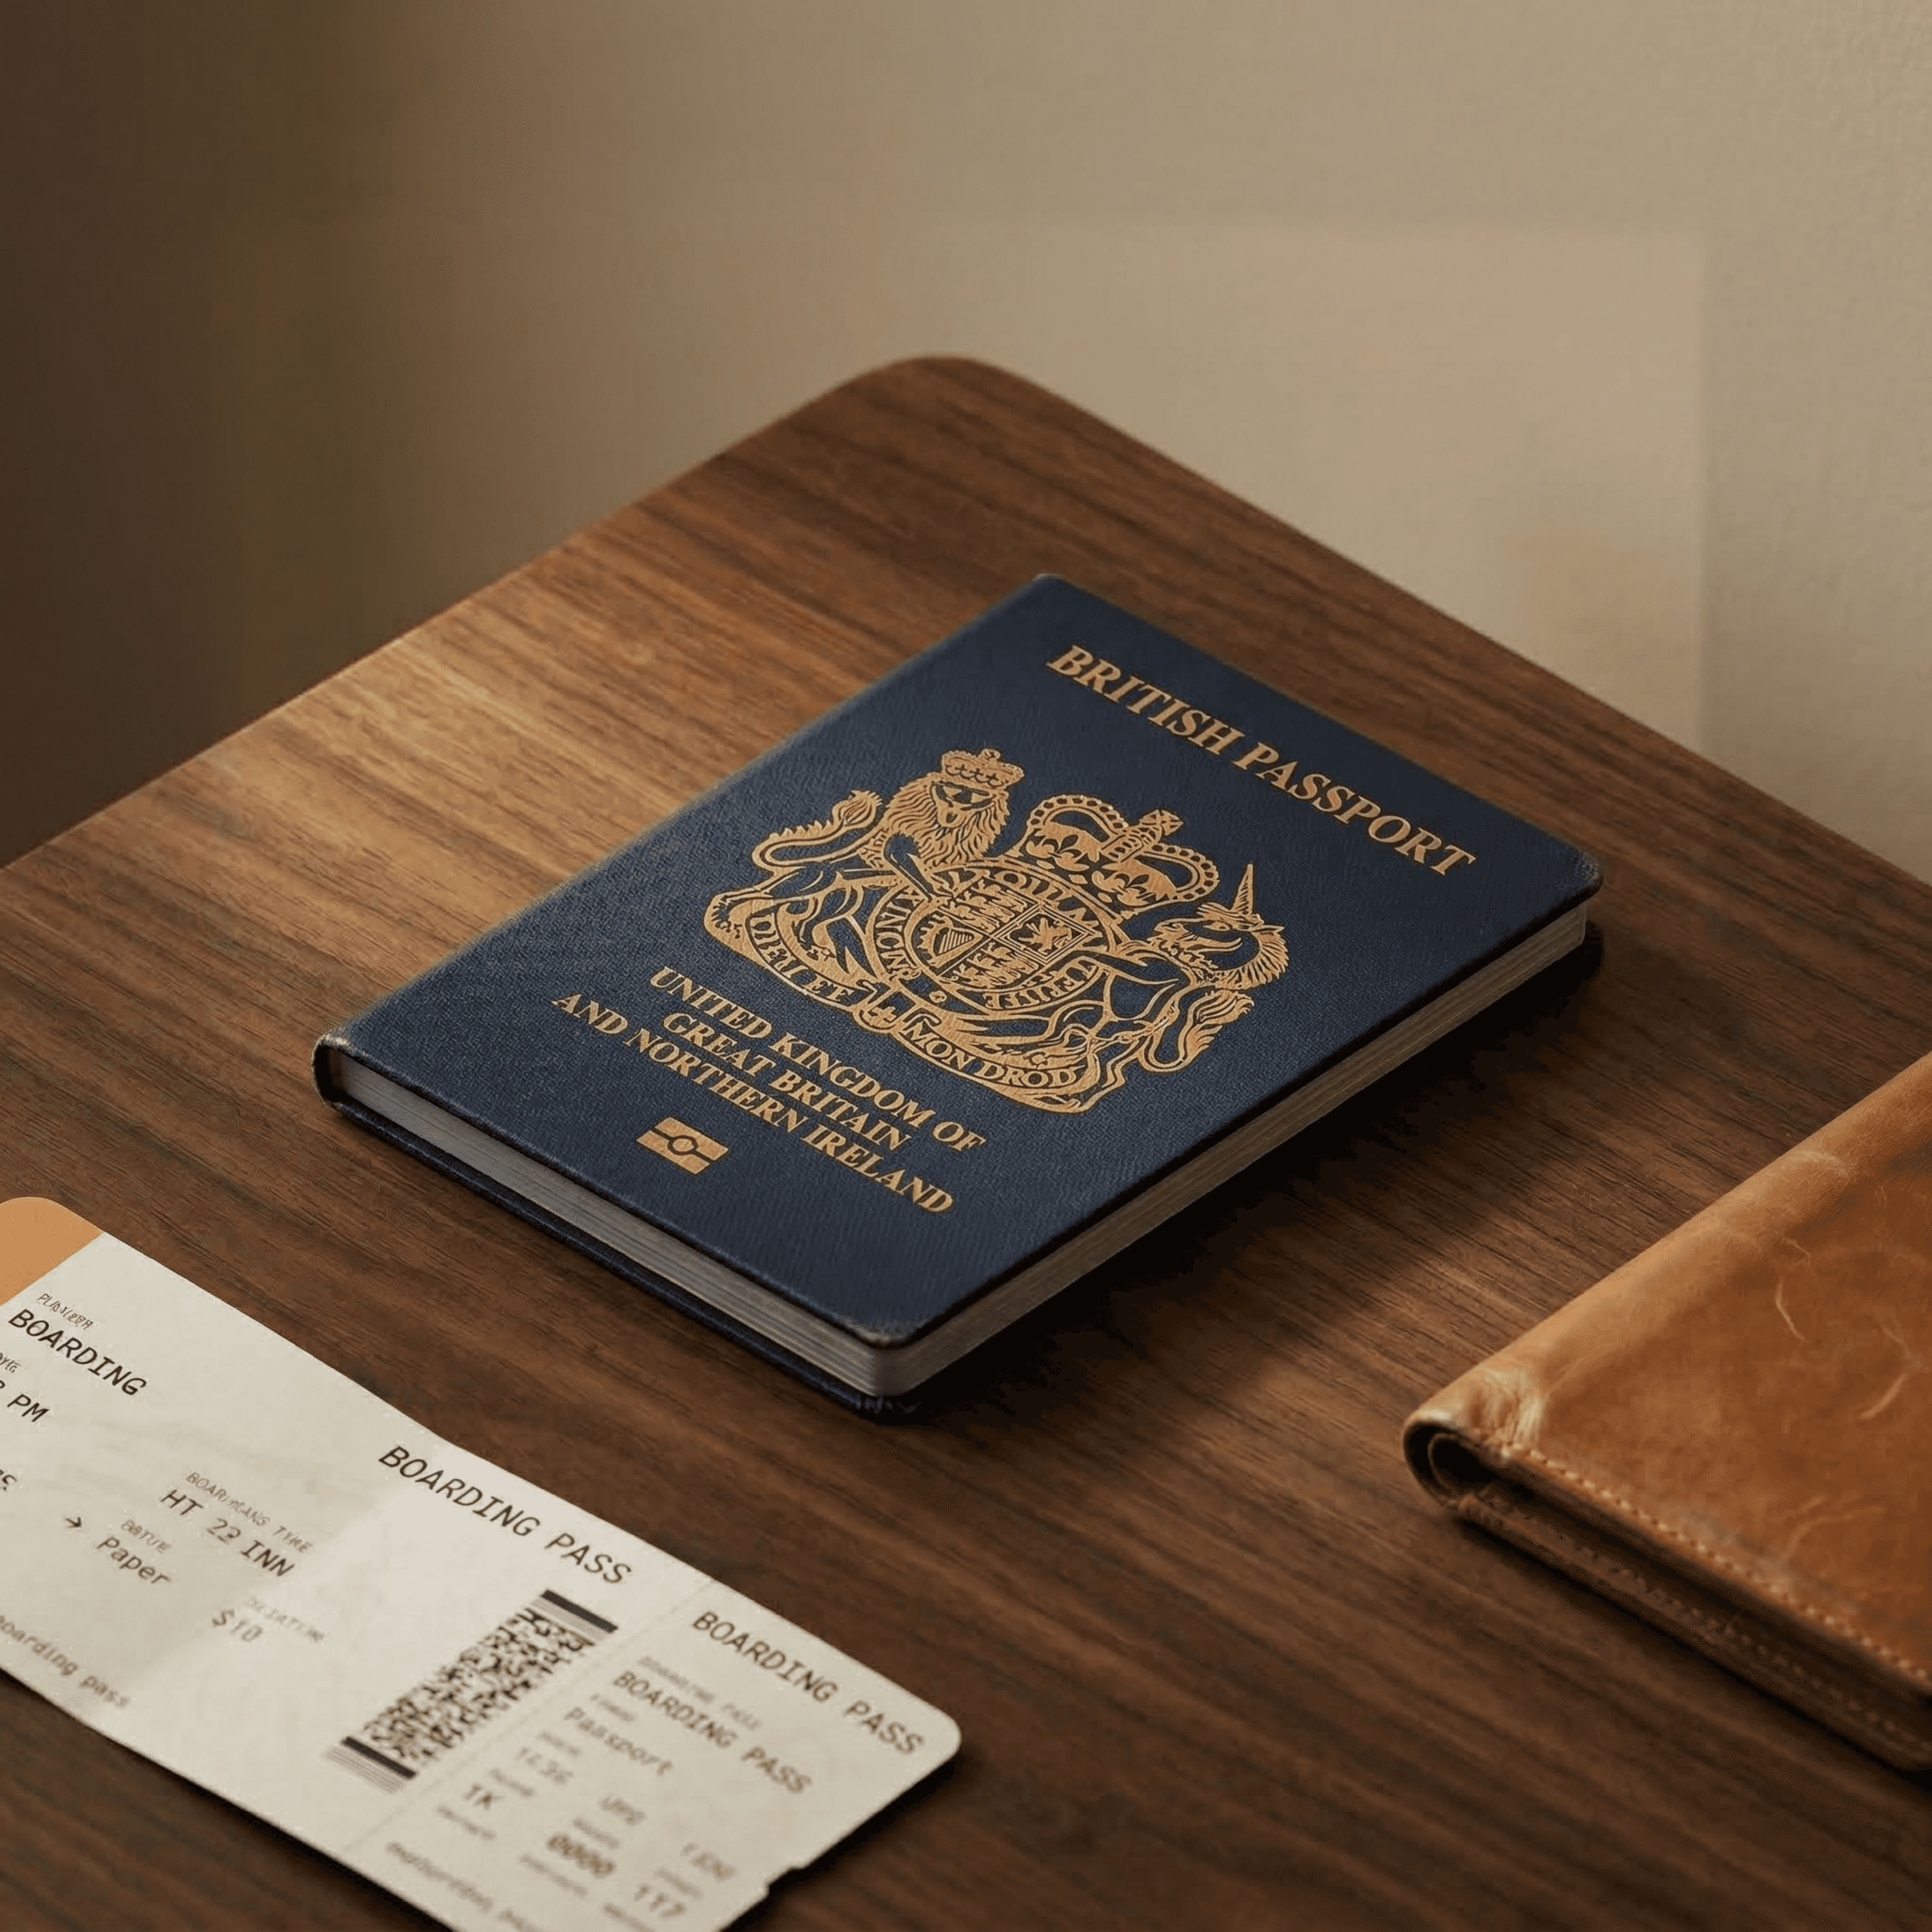
British passport, boarding pass, and wallet illustrating travel booking essentials
UPDATED AUG 2026
100+

Brands Ranked

69

Pages

9,800

Keywords

10

Min Read

100+ Brands Featured

TUI logo with smiling face icon in dark blue
Skyscanner flight search logo
Booking.com travel platform logo
easyJet airline logo in navy blue
Jet2.com airline logo in dark blue text
Ryanair airline logo with harp symbol
Expedia logo featuring circular blue icon with white airplane symbol
loveholidays holiday travel logo with smiling sun and text
Thomas Cook logo with dark blue heart symbol
Kayak logo with five navy squares and white letters
-19%

Market decline YoY

+35%

Biggest visit gain

-40%

Booking.com traffic loss

Our reports have been the UK’s No.1 search marketing benchmark for the last 10 years! Marketing decision makers spanning 60 sectors have downloaded our reports to save over 72 hours of research and discover exactly how their brand ranks against the competition in search, visibility, and growth potential.

I was extremely impressed with the insight and depth of analysis in the Salience Report... The data-driven analysis tracking visibility, authority, links, page speed, search volume, keywords, and more paints a detailed picture of brand performance and emerging trends. The team was delighted to be featured.

The Salience Travel Booking Engines Index

The UK's No.1 Travel Booking Engines Industry Report

FREE
DOWNLOAD

Across the 237 UK travel booking brands tracked in this year’s index, organic visibility fell 19.0% between June 2025 and June 2026. We ran the same question a second way, weighting by volume across the published top 100, and got -19.77%: 65,018,728 monthly visits in June 2025 down to 52,166,879 in June 2026, a loss of 12,851,849 visits a month. An unweighted count across the whole sector and a volume-weighted count across the largest hundred domains could easily have disagreed by several percentage points. They came out within eight tenths of a point of each other, which tells you the decline runs the full length of the table, from rank 1 to rank 100.

Two domains were stripped out before anything was calculated. seatguru.com fell from 129,518 monthly visits to 7,758, down 94.01%, and netflights.com from 74,188 to 9,838, down 86.74%. Every other brand in their sub-cluster landed between -6.15% and -53.24%, both dropped out of the published top 100 entirely, and neither appears in the Brand Reach Score, social or reviews data. Those are the signs of a domain that has been deprecated or folded into a parent site, so we removed them from every market-level figure on this page.

Booking.com and loveholidays.com went through the same test and stayed in. Booking.com fell 40.39%, losing 2,339,981 monthly visits; loveholidays.com fell 57.24%, losing 1,632,043. Together that is 30.91% of the total top-100 decline. Take both out of the table and the other 98 brands still fall 15.75%, from 56,373,938 monthly visits to 47,494,113.


Group Monthly visits lost Share of total decline
booking.com 2,339,981 18.21%
loveholidays.com 1,632,043 12.70%
The other 98 brands in the top 100 8,879,825 69.09%
Top 100 total 12,851,849 100%

The index scores every brand on a Brand Reach Score, combining monthly branded search volume with owned social following. It is the closest measure available of how well known a travel brand actually is to a UK searcher, and sorting the visibility table by it produces the most useful finding in this year’s data.

Of the 25 brands with the highest Brand Reach Score, none grew organic visibility. All 25 declined, at a mean of -24.34%. Of the 25 lowest-scoring brands, ten grew, at a mean of +11.41%. That is a 35.75 percentage-point spread between the best-known travel brands in the country and the operators a searcher would struggle to name, running in favour of the second group. Narrow it to the extremes and the spread widens: the top ten on Brand Reach Score have a median year-on-year change of -23.55%, the bottom ten a median of +22.57%, a gap of 46.12 points.

Branded search volume and owned social both feed the score, so it is worth separating them to check whether one is doing all the work. Sort on owned social alone and the finding survives. The ten largest social accounts in the sector averaged -22.66% year-on-year, and none of the ten grew. Qatar Airways carries 40,200,000 combined followers and the highest owned social score in the index at 71,150; its visibility fell 24.65%. If your forecasting model uses branded search growth as an input to non-branded projections, this year breaks it.


Brand Owned social score YoY visibility
Qatar Airways 71,150 -24.65%
Booking.com 39,920.1 -40.39%
Emirates 35,350 -33.09%
Trivago 25,995.75 -6.15%
Turkish Airlines 25,550 -28.34%
Skyscanner 20,219.15 -22.45%
Expedia 14,702.7 -32.81%
TUI 13,710.6 -16.56%
Group average -22.66%

The clearest single illustration sits at rank 4 and rank 5. In June 2025 Booking.com had 5,793,373 monthly organic visits against Jet2holidays’ 3,345,688, a lead of 73.16%. Twelve months later Jet2holidays is on 3,574,264 and Booking.com on 3,453,392, so Jet2holidays leads by 3.50% and has taken rank 4, with Booking.com dropping one place to rank 5.

Jet2holidays is the only brand in the visibility top five sitting outside the Brand Reach Score top ten. It is Brand Reach rank 30. It takes 90,500 branded searches a month against Booking.com’s 823,000, which is 9.09 times fewer, and carries an owned social score of 2,382 against 39,920.1, 16.76 times smaller. On every available measure of how well known it is, Jet2holidays is a mid-table travel brand, and on organic visibility it now ranks above the largest travel booking platform in the world.

Divide visibility by branded demand and the same result appears. Booking.com returns 4.20 monthly organic visits for every branded search. Jet2holidays returns 39.49, roughly nine and a half times the rate.

Hays Travel grew 35.09%, adding 189,034 monthly organic visits to reach rank 18, the biggest absolute gain anywhere in the index. Trailfinders grew 29.50%, adding 127,791 visits. Barrhead Travel grew 78.34%, adding 43,958. All three are licensed operators selling through staff, competing for category-level rankings against platforms with far larger brand recognition.


Brand Jun 2025 visits Jun 2026 visits YoY Rank
Jet2holidays 3,345,688 3,574,264 +6.83% 4 ↑1
Booking.com 5,793,373 3,453,392 -40.39% 5 ↓1
Hays Travel +35.09% 18
Trailfinders +29.50%
Barrhead Travel +78.34%

A contraction of this size usually arrives with an assumption attached: that the big platforms are consolidating the category, taking share while smaller operators are squeezed out of the SERP. The share data gives no support to that reading.

Top-five share of top-100 visibility moved from 47.74% to 47.97%, a change of 0.23 of a percentage point. Top-ten share moved from 65.74% to 64.86%, falling by 0.88 of a point. Top-twenty share went from 82.16% to 82.36%, up 0.20. The distribution of the category is almost exactly where it was twelve months ago while the total volume inside it dropped by 12,851,849 visits a month.

That has a direct consequence for how travel teams report search performance. Share-of-category can read completely flat this year while the volume underneath it falls away. TUI held rank 1 and posted +2.44% against the market while losing 1,475,598 monthly visits; easyJet posted +4.12% and climbed to rank 2 while losing 962,644. Their combined loss of 2,438,242 visits exceeds Booking.com’s entire decline of 2,339,981. Any monthly pack that leads on share of voice needs an absolute-volume line sitting next to it for the 2026 cycle.

Two pieces of work follow from that. Audit how many destination, month-modified and airport-modified category pages actually exist on your site, how deep the internal linking reaches into them, and whether each one carries enough content depth and correct schema markup to hold a ranking position against a platform. Then pull the appearance rate of Google’s flight and hotel modules, and AI Overview presence, across your top 200 non-brand queries.


Band Jun 2025 share Jun 2026 share Change
Top 5 47.74% 47.97% +0.23pp
Top 10 65.74% 64.86% -0.88pp
Top 20 82.16% 82.36% +0.20pp
Top 100 volume 65,018,728 52,166,879 -19.77%

Brand leaders who loved our reports

"I am massively grateful for this report and there aren't many other useful ones I have found for online flower services."

"Really impressed with the work done behind the research, really well done to the team and Salience"

"The report it was very interesting as has been the case in previous years."

Yes. We give them away because the only thing we need from you is your email. No payment, no credit card, no catch.

We refresh every report twice a year. The 2026 Travel Booking Engines Index uses data collected in June 2026, for the period June 2025-June 2026.

Unfortunately, due to the nature of the beast, we cannot gather data for every single website that ranks for a travel booking engines keyword and considers itself a travel booking engines brand. We rank the 100 largest by organic visibility in the UK. However, if yours isn’t there, we’re more than happy to gather some data for you using the full range of tools at our disposal. If you’d like custom data, get in touch.

Request custom data

No. We are committed to making this report the single best free asset for in-house travel booking engines marketers. Our sector reports are far removed from a lead magnet. That said, it’s impossible for us to share all the insights that can be gleaned from the data in the PDF alone. We will follow up with additional analysis, written by us, sharing our thoughts on the data based on our 15 years of experience as the search agency behind some of the UK’s biggest brands. This often includes analysis of where search marketing is going within the industry and brand spotlights, where we break down why we think certain brands are doing well. We maintain that you can unsubscribe from this additional content if you wish. It will never be a sales push, only ever added value.

Yes. We spend tens of thousands of pounds a year on top-of-the-line software, tools and proprietary systems that we have at our fingertips, and are more than happy to help you with your data needs. Get in touch with a brief.

Request custom data

Still scrolling? Here's the full 69-page report.

Download the free report
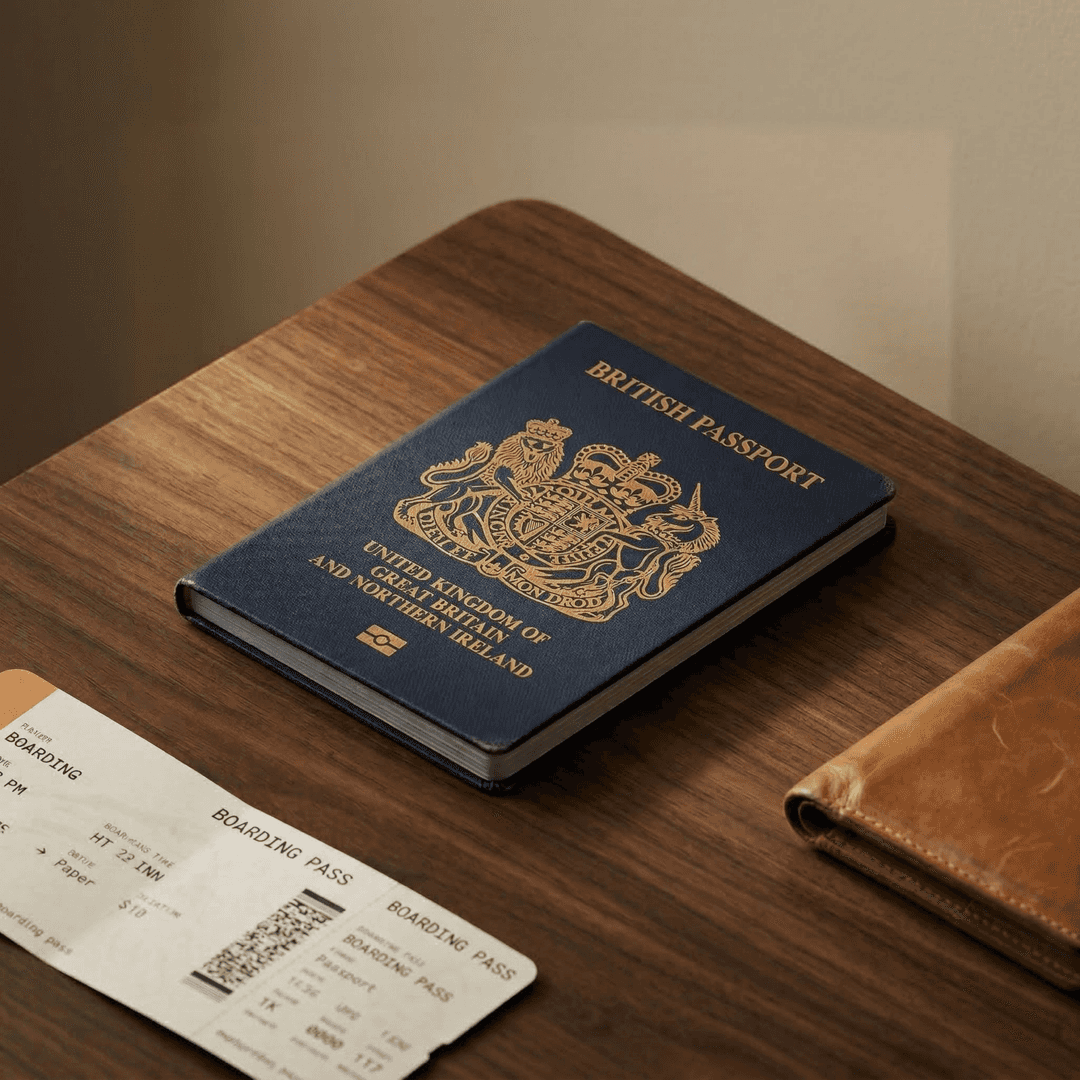
British passport, boarding pass, and wallet illustrating travel booking essentials