by Sean
The only brand in the top five that grew
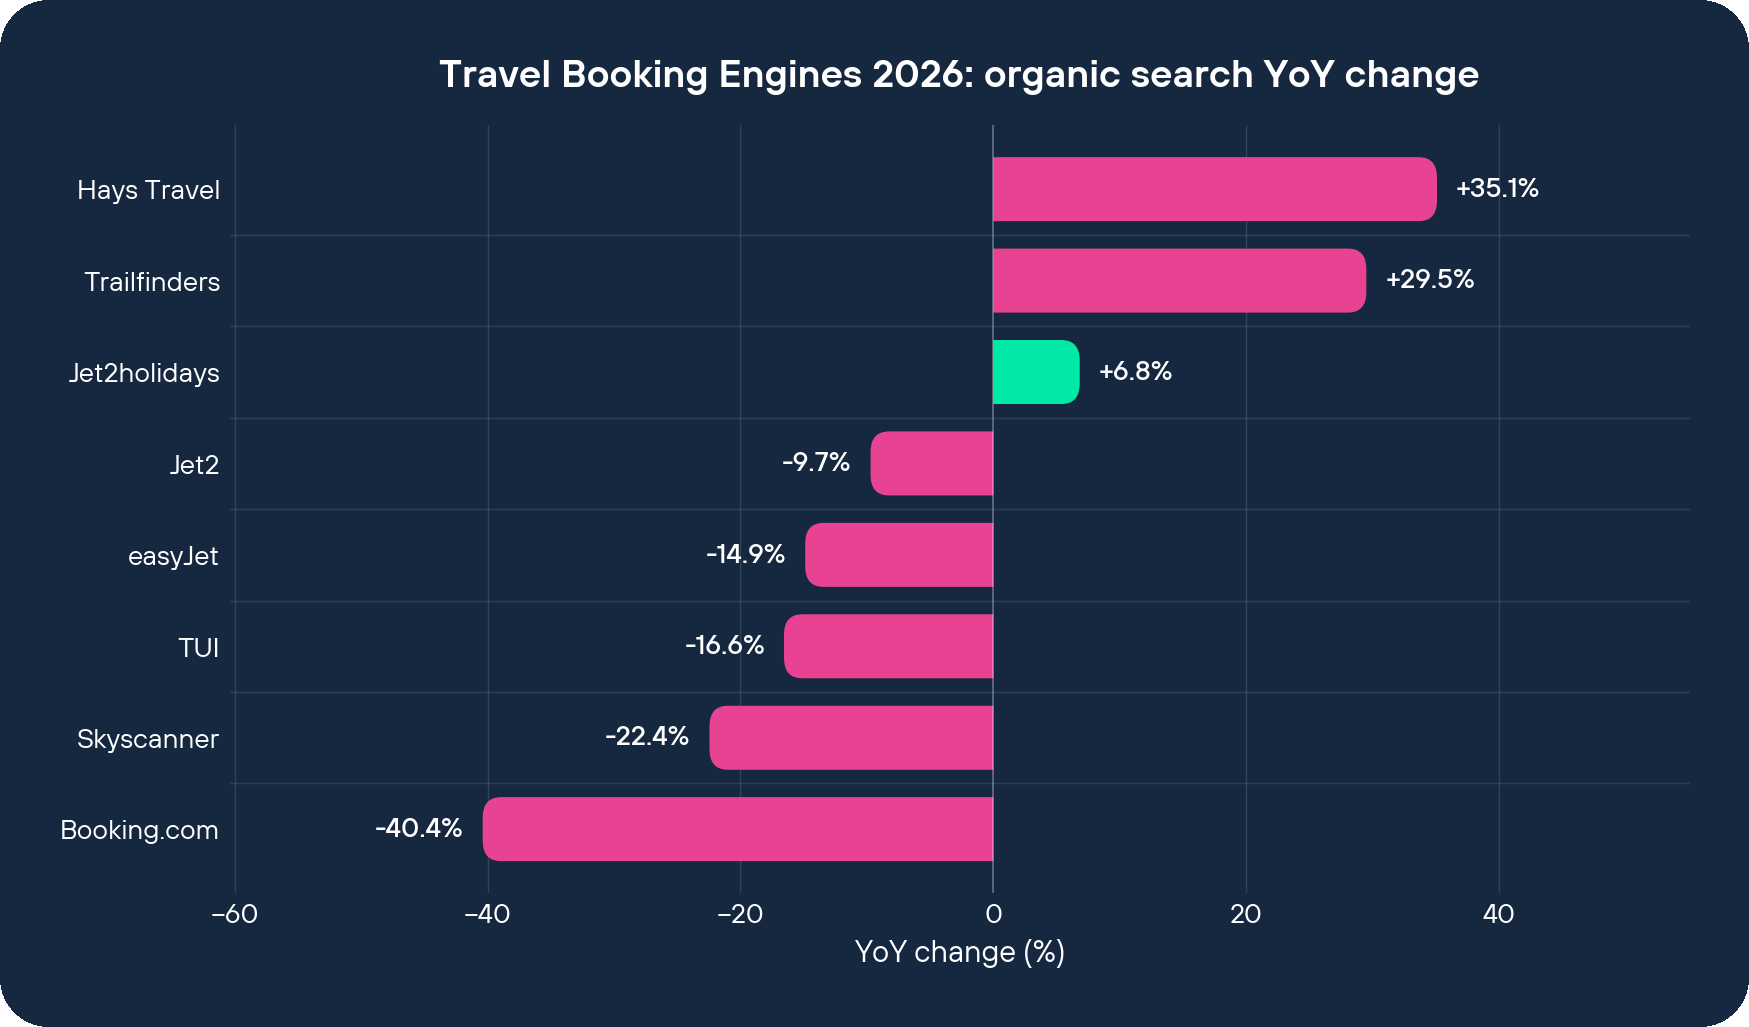
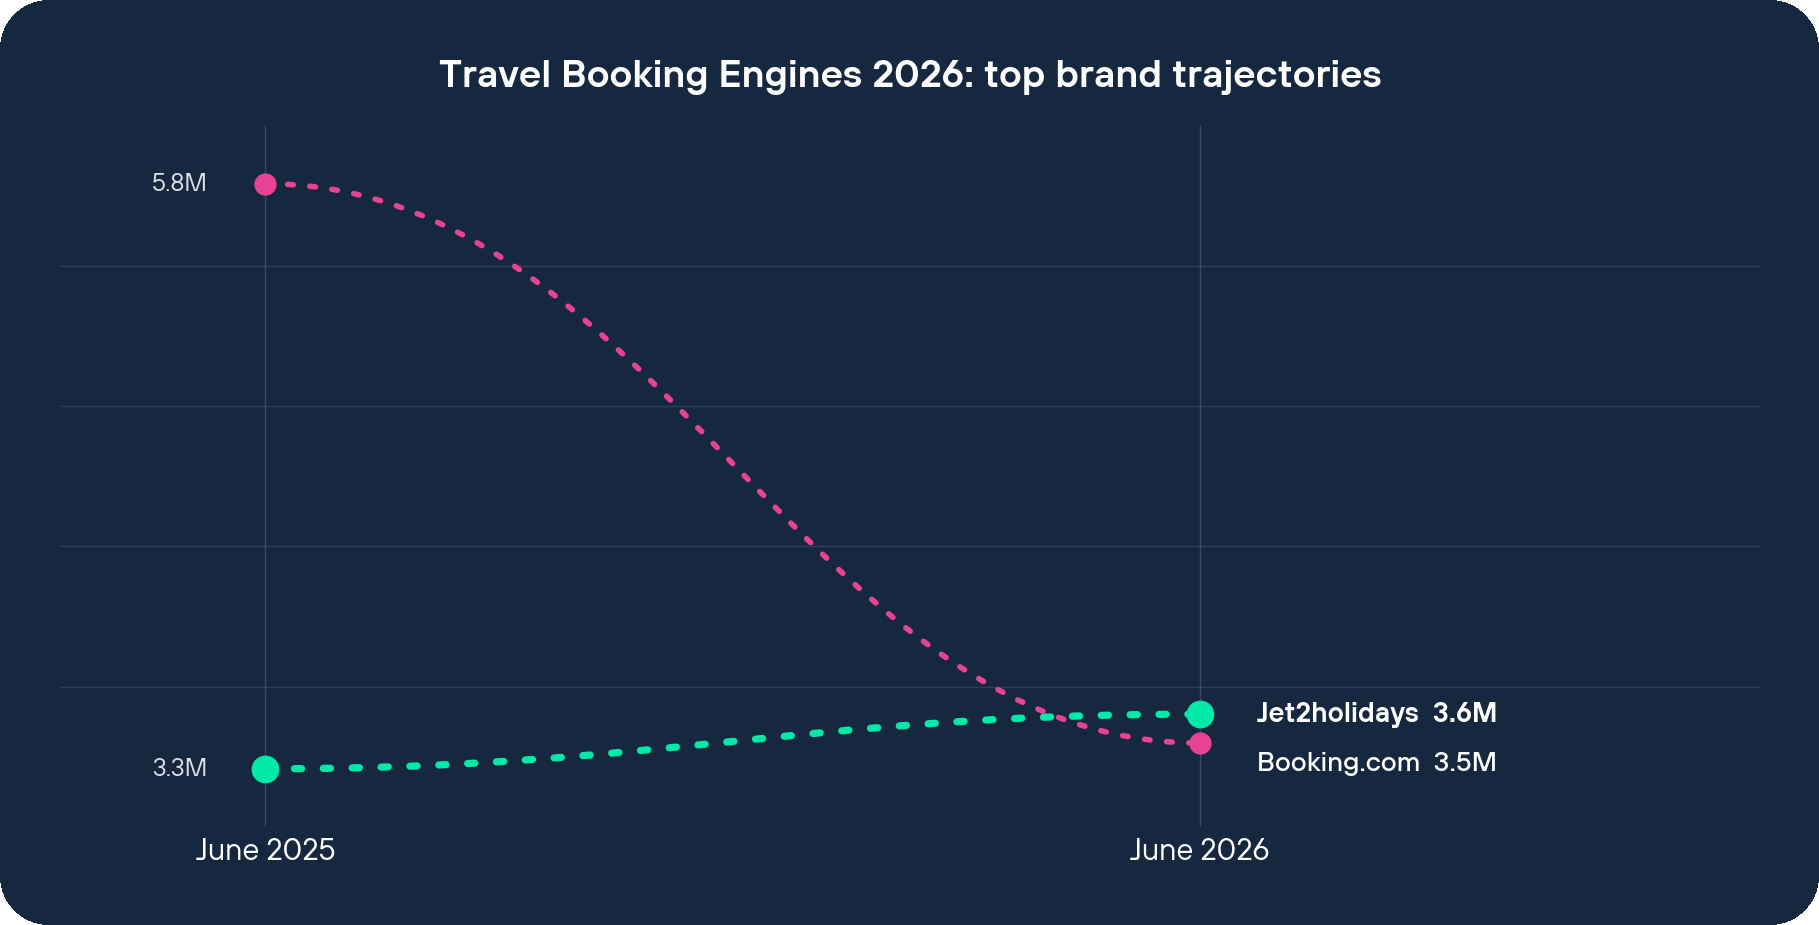
Between visibility june, 25 and visibility june, 26, Jet2holidays went from 3,345,688 to 3,574,264 monthly visibility. That is a gain of 228,576, or +6.83%, in a market of 237 brands that fell 19.0% overall. Measured against the market it is +25.83 percentage points. Click below to access the latest Travel Booking Engines market report.
The rest of the top five had a different year. TUI held rank 1 on 7,434,766 but lost 1,475,598 (-16.56%, which registers as +2.44% against the market). easyJet climbed to rank 2 on 5,507,584 while losing 962,644 (-14.88%, +4.12%). Skyscanner sits at rank 3 on 5,055,645 after losing 1,463,705 (-22.45%). Booking.com fell from 5,793,373 to 3,453,392, a decline of 2,339,981 or -40.39%, which is the largest absolute loss anywhere in the index and which dropped it below Jet2holidays into rank 5.
This is worth pausing on, because the “% vs market” column is doing a lot of flattering work in a year like this one. TUI’s +2.44% and easyJet’s +4.12% describe brands that lost 1,475,598 and 962,644 visits respectively and simply lost less than average. Jet2holidays’ +25.83% describes a brand whose absolute number went up. It is the only one of the five where that is true, and its outperformance against the market is more than ten times TUI’s.
For scale: the 228,576 Jet2holidays added is 19.24% of the +1,187,837 that all 23 growing brands in the top 100 added between them. One operator produced roughly a fifth of the entire upside in this market.
It grew from the bottom half of the Brand Reach table
The Brand Reach Score combines branded search volume with owned social reach, and it is where this gets interesting. Jet2holidays sits at BRS rank 30 out of 50, on 90,500 monthly brand searches and a social score of 2,382. Booking.com sits at BRS rank 2, on 823,000 monthly brand searches and a social score of 39,920.1. Jet2holidays overtook it with 9.09x less branded search demand and 16.76x less social reach.
Across the whole index, 0 of the top 25 brands by brand reach grew and 10 of the bottom 25 did, with a mean YoY of -24.34% for the top cohort against +11.41% for the bottom, a gap of 35.75 percentage points. Jet2holidays is the clearest case in the dataset, because it is the only brand that made it into the visibility top five from outside the top ten brands by brand reach.
Divide visibility by branded search and you get 39.49:1 for Jet2holidays against 4.20:1 for Booking.com, which is 9.41x more visibility per unit of brand demand. Treat that ratio as a comparison rather than a conversion rate, it divides an estimated visibility figure by a keyword volume, and the two are measured differently. There are also two things in the underlying numbers that you should know before you quote them. First, the Jet2 brand is split across two domains in this index: “Jet2” carries 823,000 monthly searches against jet2.com, which fell -9.71%, while “Jet2 Holiday” carries only 90,500 against jet2holidays.com. A good share of the demand the package business converts arrives through searches counted on the airline’s line. Second, the social score recorded for Jet2 Holiday (2,382) is identical to the score recorded for Jet2 (2,382), which looks like one set of accounts counted against both entries. The 16.76x social gap is directionally right and numerically soft.
Twelve departure airports and a finite list of destinations
Jet2holidays is the tour operating arm of Jet2 plc, sitting alongside the airline, and it is now the UK’s largest tour operator by ATOL-licensed passengers, a position it took off TUI UK. It contracts its own hotel allocation, flies its own aircraft, and runs its own airport transfers. That vertical control determines what it can publish.
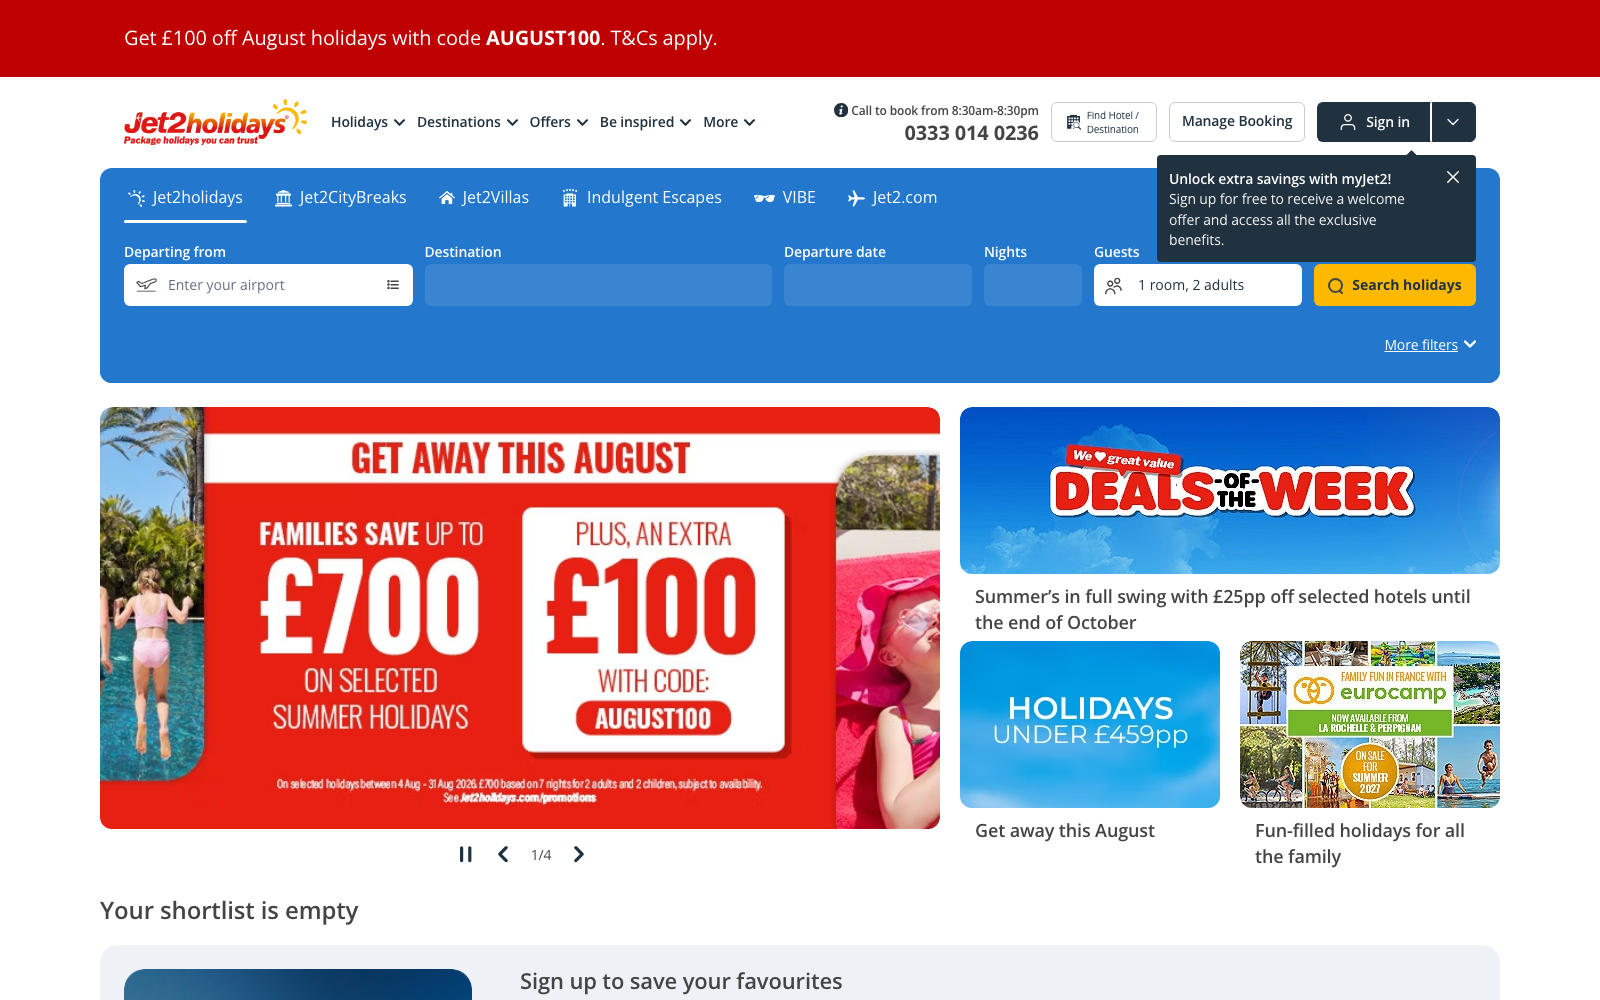
Every page it needs corresponds to something it actually sells: a departure airport, a destination, and a product line. The departure airports include Leeds Bradford, Manchester, Newcastle, Birmingham, East Midlands, Glasgow, Edinburgh, Belfast, Bristol, Stansted, Luton and Liverpool. Multiply those by the countries and resorts it flies to and you get a bounded set of landing pages, holidays from Manchester, all-inclusive Tenerife, Costa del Sol from Newcastle, where each one has live availability and a price behind it. The four product lines, Jet2Villas, Jet2CityBreaks, Indulgent Escapes and the adults-only VIBE range, filter the same contracted stock rather than generating new permutations of it. The trust messaging that runs across those templates, 22kg hold baggage, 10kg hand luggage, return transfers, ATOL protection, low deposits, Free Kids’ Places, answers exactly the comparison questions the query contains.
The reason this plausibly matters to the search data, rather than just being a nice description of a website, is the query mix it points at. Demand of the form “package holidays from Newcastle” or “all inclusive Tenerife from Manchester” is transactional, changes daily with pricing and availability, and needs a booking path to be useful. That is the category of query where an AI Overview is least able to give a complete answer and most likely to hand the user to a page that can. Informational travel demand, where to go in October, what Benidorm is like, is precisely what got absorbed elsewhere, and keeping any share of it now depends on content built to earn AI Overview citations. I am describing a plausible reason, not a proven one; nothing in this dataset separates query types, and I would want click-level data by query class before I asserted it as fact.
Booking.com ran the opposite model on every axis. It owns no inventory, so it monetises other operators’ stock through an effectively unbounded programmatic page set built from city, property type, filter and date combinations, and it feeds that with the largest branded search volume and the second-largest social score in the index. In June 2025, the year our 2025 travel booking sector analysis covers, it was 73.16% ahead of Jet2holidays. In June 2026 Jet2holidays was 3.50% ahead of it. The assets that were supposed to make organic visibility defensible, brand equity plus page volume, are what got repriced hardest.
Five of the eight sites we crawled returned nothing
When we ran a plain, non-JavaScript HTTP fetch across eight sites in this sector, five gave us nothing usable. jet2holidays.co.uk returned an empty response. easyjet.co.uk returned an Akamai “Access Denied” page (reference #18.137a2617). booking.com returned an empty body. skyscanner.co.uk returned only the string “Unable to load translations, try refreshing the page?”. trailfinders.com returned nothing. The one site that served complete server-rendered inventory was haystravel.co.uk: full stock, prices, tax disclosures and destination hub pages, all present in raw HTML.
The tempting reading is that server rendering explains the growth, and the data does not support that cleanly. Hays Travel grew +189,034 (+35.09%) and renders everything. Trailfinders grew +127,791 (+29.50%) and returned nothing to the same crawler. Jet2holidays grew and also returned nothing. What the split does tell you is that the larger brands in this sector are now readable only to crawlers they have explicitly allowed through, which was a manageable position in 2020 and is a riskier one in 2026, when the systems fetching your pages include answer engines with far less patience for client-side rendering than Googlebot has.
The other explanations, listed honestly
Several things could have moved this number, and most of them are invisible in this dataset.
The obvious one is the “Nothing beats a Jet2 holiday” advertising audio, which became a very large TikTok meme and gave the brand a level of unpaid awareness no media budget buys. The timing does not fit the story neatly, though: it was already circulating well before the June 2025 reading, so much of that lift is inside the comparison base rather than added on top of it. And the brand demand it created attaches mostly to “Jet2”, which sits on jet2.com, a domain that fell -9.71% over the same period.
Capacity is duller and probably more relevant. Jet2 plc has been adding aircraft and departure airports, and every new airport-and-destination combination is a new sellable product with a page behind it. Growth in indexable pages that map to real stock is a boring driver, and boring drivers are usually the real ones.
Competitor decline accounts for part of the rank movement rather than the visibility gain. Loveholidays lost 1,632,043 (-57.24%), TUI lost 1,475,598, On the Beach lost 395,564 (-16.90%), First Choice lost 177,675 (-30.24%), Travel Republic lost 157,138 (-62.44%) and Sunshine.co.uk lost 162,197 (-60.35%). Rising to rank 4 in that company takes less doing than it would in a flat market.
Distribution matters too, and it cuts across the index. Jet2holidays sells heavily through independent travel agents as well as direct, and Hays Travel, the largest independent agency group in the UK and a major seller of its packages, is the second-biggest gainer here at +189,034 (+35.09%). Two businesses selling overlapping product both rose. That is worth noticing before crediting either one’s website.
Finally, the whole index fell 19.0%, and a decline that uniform across 237 brands usually reflects how results are being presented rather than 237 separate commercial stories. Jet2holidays grew inside that, which is the interesting part, but the level everyone is being measured against dropped for reasons no individual brand controls.
Reviews do not sort this table at all. Jet2holidays carries 472,842 reviews at 4.4 stars. Loveholidays, whose earlier organic run we looked at in how Loveholidays built its organic visibility, carries 268,705 at the same 4.4 and lost 57.24%. Hays Travel has 403,313 at 4.9 and grew. Trailfinders has 66,931 at 5.0 and grew. easyJet has 66,895 at 3.6, lost 962,644, and still climbed to rank 2. Review volume and star rating are worth having for conversion, and they explain none of this movement.
What the data supports
Concentration did not increase. The top five’s share of visibility barely moved, from 47.74% to 47.97%, and the top ten’s share fell from 65.74% to 64.86%. Jet2holidays’ gain was a reallocation between operators rather than the market consolidating around its biggest names.
What the data does support is narrow and worth stating precisely. In this index, brand equity and page volume stopped protecting visibility, and the brands that held or gained were the ones whose page inventory corresponded to a finite set of things they could actually sell. Jet2holidays is the strongest example because it is the only one that managed it at the top of the table, from BRS rank 30, against a competitor with 9.09x its branded search demand. Whether the vertical model caused that, or whether it made the brand incidentally resilient to a change in how travel results are presented, this dataset cannot tell you. Both readings point at the same practical question for anyone in this sector: how many of your indexed pages correspond to stock you control, and how many exist because a template could generate them.
The full Travel Booking Engines report has the visibility, Brand Reach Score and crawl results for every brand in the index, including the ones not named here. If you want to know what a plain fetch returns for your own site, and how much of your indexed page set corresponds to stock you control, that is where our technical SEO, crawlability and indexation help starts.