 by Michael
Here are two numbers from the same retailer, in the same category, twelve months apart.
Their first organic result moved from average position 1.66 to 1.43, a genuine improvement. But their share of page one fell from 81% to 75%.
Nothing went wrong with their SEO; their rankings improved, but the page just stopped being mostly theirs.
That gap between the two numbers is the thing I’d want every retail marketing director in Britain to look at this quarter, because almost no reporting pack in the country is set up to show it. Rank tracking will show you the first number every time. What it won’t show you is the second, and the second is the one that actually decides your reach into the market.
Google used to give you slack for being famous
For most of the last fifteen years, a strong consumer brand functioned as a ranking subsidy.
Argos is the cleanest example, and I mean this affectionately. For years, their site broke a decent proportion of the technical rulebook. Page targeting was loose, content was thin in places. It ranked, anyway, at the top across an enormous commercial territory because Google had built up enough understanding of what Argos was to give it the benefit of the doubt. Brand recognition did the work that architecture should have been doing.
That subsidy was real and worth a fortune. It also had a peculiar side effect: the businesses receiving the largest subsidy had the least incentive to fix anything underneath it. Why would you rebuild category architecture when the rankings are already fine?
The subsidy hasn’t been removed. It still applies inside the blue links, which is why the retailer I opened with saw their organic position improve. What’s changed is that the blue links no longer take up most of the page, and the surfaces that took up that space don’t extend the same courtesy. It’s the same shift we wrote about when Google started putting its own answers above the results.
The page has been rebuilt around features, and it’s happened everywhere
We track SERP composition across keyword universes rather than individual keywords. A universe is every commercial or research query that makes up a market, weighted by demand, so you’re looking at what the market sees rather than what one term does.
Across eight UK keyword universes in six sectors this July, the share of page one for organic blue links had fallen year on year in every single one. No exceptions, not one market where organic held its ground.
The range runs from 3.6% down at the shallow end to 10.4% down at the deep end. Median around 8%. The categories are unrelated: footwear, paint, pet food, home cinema, headsets, and online pharmacy. These markets don’t share a competitive structure, a margin profile, or a buying cycle, yet they’re all moving in the same direction.

Eight keyword universes, six sectors, July 2026. Every market lost organic share; none gained.
Feature density is where it gets stark. In the men’s trainers market, the average search returned 0.97 non-organic features a year ago. It now returns 2.12. The number of Google-generated blocks sitting alongside the organic list roughly doubled in twelve months.
Two features account for most of it, and which one depends on where the shopper is in the journey.
For commercial queries, product grids fired in 89%-94% of searches across every retail category we looked at. That’s not confined to head terms or market leaders; it’s nearly universal. In the paint market, that grid sits above the first organic result on 34% of searches.
For research queries, AI Overviews fire at 40%-100% depending on category, and where they fire, they sit above organic almost every time. In one market, it’s every single query in the set.
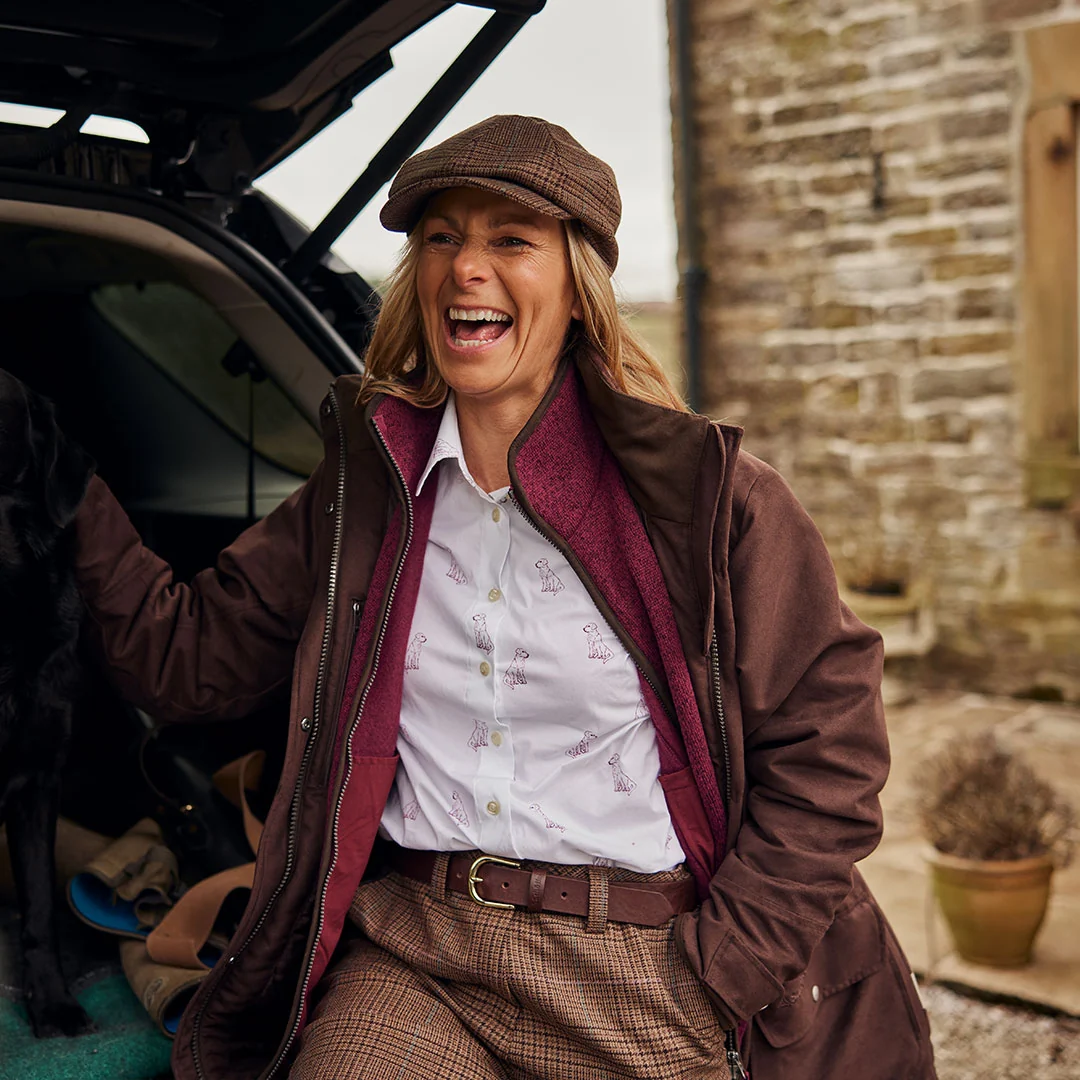
Schöffel Country more than doubled its organic revenue.
Known to everyone inside the shooting field and almost nobody outside it. We rebuilt the site around the words its customers were actually typing, then protected every ranking through a replatform that landed weeks before peak trading.
The surfaces are being won by people who don’t sell anything
This is the part I didn’t expect, and it’s the reason I think the “big brands are losing to nimble challengers” framing is wrong.
Take the UK paint market, 478 commercial keywords, 359,000 monthly searches. The most recognised retail brand in the category holds 42.9% of all top-three organic positions, a textbook case of category dominance.
Its presence in product grids is zero.
Not just low, zero, on a surface firing on 93% of searches in its own category. And the grid slots it isn’t in are held by Amazon at 87%, a price comparison engine at 65%, a trade merchant at 61%, and a builders’ merchant at 58%.

It’s the same market, but two entirely different surfaces, and the brands that own the blue links are, almost without exception, the ones missing from the grid.
Same pattern, different market. A national pharmacy chain with hundreds of branches scores 2.9 on composite surface ownership. The NHS website scores 82.9. In pet food research queries, a national pet retailer with a store in every retail park in Britain is out-owned by an independent dog food review blog. Google cites itself in 48% of those AI Overviews, while Reddit turns up in 27% and The Telegraph in 27%.
And my favourite, because it’s the purest version: in one consumer electronics category, the company that actually manufactures the product scores 7.5 on surface ownership against Amazon’s 28.6, with zero presence in the grids that fire on 86% of searches for the thing it makes.
None of these are challenger brands beating incumbents. They’re forums, marketplaces, comparison engines, and public institutions occupying commercial retail surfaces, while retailers hold the shrinking surface. It’s the same downstream story we found when we traced where AI visibility actually sends the traffic.
Features arrive from nothing, and they leave too
One more thing worth knowing, because it’s the bit that makes this hard to keep up with, rather than just hard to hear.
In the men’s trainers market, a feature called Compare Sites went from 0% prevalence to 77.7% in twelve months. From not existing to firing on three-quarters of searches, sitting at average position six, above the first organic result on 17% of queries. I’d wager the number of UK retail marketing teams with that on a dashboard is close to none.
In the same market and the same period, Image Pack prevalence fell from 94.9% to 24.3%. A feature that was on almost every search is now on a quarter of them.
So the honest version of this is not “features only go up.” It’s that the composition of the page is now genuinely unstable, on a twelve-month cycle, in ways that no annual planning process is built to absorb. Any strategy pinned to a specific feature is fragile, but a strategy built on measuring share of the whole page isn’t. That principle is exactly why we rebuilt the Salience Index around surface ownership.
Why a strong brand is the worst possible early warning system
Three reasons this goes unnoticed for years in exactly the businesses that can least afford it.
Paid backfills the gap. As organic visibility erodes, paid search picks up the demand, because the demand hasn’t gone anywhere. Blended acquisition performance looks acceptable. What’s actually happening is that you’re buying traffic you used to earn, and the cost of that swap climbs, year on year, in a line item nobody is examining as a visibility problem.
Rank tracking reports good news, and it’s accurate. Brand equity survives longest on head terms, and that’s exactly where most rank tracking is concentrated, so a position moving from 1.66 to 1.43 looks like genuine progress because, in a narrow sense, it is. It’s just not an answer to the question that actually matters.
Brand tracking isn’t wrong, awareness and consideration both hold up, and the stores stay busy. But that’s a different question from whether people can find the brand at all, and most businesses have no way to measure that second thing.
Put those three together, and you get a business where every dashboard is green and organic share has been falling for three years.
What I’d actually do
Stop asking where you rank, and start asking what proportion of the surfaces that decide your category you appear on at all.
That’s a different exercise, and it needs a different measurement. For each surface that fires in your market, grids, AI Overviews, image packs, comparison modules, whatever else has turned up since you last looked, you want two figures. How often does it fire, and on what percentage of those does your brand appear?
Where the answer is zero, you have found something more valuable than a ranking opportunity. You’ve found a surface where your competitors are being seen, and you are not present in any form, on a page where you may still be ranking first.
Then audit absence rather than position, because absence is where the compounding damage is. And be honest about where specificity beats scale: on short generic commercial queries, the new surfaces lean heavily on price, and a full-price retailer will lose those regardless of how good its data is. The winnable ground is further down the tail, where relevance and specificity count for more than being cheapest. Pick those battles deliberately, rather than competing everywhere and losing quietly.
None of this means brand investment was wasted. Blue links still carry more weight than any other single surface, and a recognised brand still converts better when it gets the click.
Brand strength used to cover for weak findability. Now it just makes strong findability perform even better, which means a great brand with no findability underneath it isn’t doing much of anything.
Salience tracks SERP composition across full keyword universes in UK retail categories. Figures in this piece are from eight keyword universes across six sectors, July 2026.
Get our thinking on search, every Friday.
Campaign breakdowns, what is actually shifting in search, and the numbers behind the work. One email each Friday, and one click to leave.