


 10
10 2025 Headphones & audio equipment Industry Analysis
If you sell headphones, speakers, earbuds or audio accessories in the UK, this 2025 Headphones & audio equipment Industry Analysis gives you a clear view of who’s winning organic visibility, where audience interest is shifting, and how brand strength shows up across search and social. I’ve pulled out the most telling metrics from the sector index and added commentary on what they say about consumer and search behaviour this year.
What’s moving the market in 2025?
Search behaviour keeps evolving. Branded demand remains a decisive moat, but we’re seeing surges around niche use-cases (running and swimming), connection formats (USB-C and wired), and home-audio nostalgia (vinyl and record-player setups). Page experience is still table stakes. Trust signals and reviews influence click-through as much as rankings. And brand awareness blends classic branded search with owned social reach — the two together show who people actually seek out.
Which headphones & audio keywords are fiercest right now?
High-competition terms skew towards core product categories and mainstream use cases. These keywords are crowded, volatile and brand-weighted.
High-competition keywords (UK)
| Rank | Keyword | Monthly searches | Competitiveness |
|---|---|---|---|
| 1 | noise cancelling headphones | 36,000 | 52 |
| 2 | bluetooth speaker | 29,000 | 33 |
| 3 | bone conduction headphones | 18,000 | 39 |
| 4 | bone headphones | 1,800 | 39 |
| 5 | speakers | 15,000 | 22 |
| 6 | bluetooth earbuds | 8,100 | 38 |
| 7 | sleep headphones | 3,800 | 24 |
| 8 | earbuds | 22,000 | 15 |
| 9 | portable speaker | 3,600 | 22 |
| 10 | bluetooth earphones | 2,600 | 22 |
Analysis. These are classic, mass-market search moments where big retail and legacy audio brands concentrate spend and authority. Expect high intent but lower click-through for non-brands unless the SERP shows clear price/feature advantages or rich results. The presence of “sleep headphones” hints at wellness-driven use cases expanding beyond commuting and exercise. “Bone conduction” continues to mature from curiosity to practical category — good for safety-first and sport contexts.
Thought leadership. The pattern speaks to a broader consumer split: convenience-first Bluetooth for daily life vs. specialised scenarios (sleep, safety, sport) that value form factor over fidelity. Gen Z and younger Millennials are comfortable trialling new formats (bone conduction, open-ear) discovered via social search; older cohorts still anchor on well-known brands for noise-cancelling and speakers. Brands may need to consider experience-led landing pages that qualify intent (commute, office, gym, sleep) before pushing product lists — this improves fit and reduces returns.
Where are the lowest-friction wins?
Opportunity keywords carry solid volume with less competition. This is where challenger brands catch up and leaders defend edges.
Opportunity keywords (UK)
| Rank | Keyword | Monthly searches | Competitiveness |
|---|---|---|---|
| 1 | running headphones | 3,800 | 4 |
| 2 | swimming headphones | 4,000 | 8 |
| 3 | pc speakers | 4,400 | 7 |
| 4 | gaming headphones | 4,000 | 4 |
| 5 | soundbar for tv | 4,100 | 8 |
| 6 | wireless earphones | 3,600 | 14 |
| 7 | wired headphones | 6,800 | 6 |
| 8 | wireless earbuds | 11,000 | 12 |
| 9 | over ear headphones | 8,100 | 3 |
| 10 | noise cancelling earbuds | 13,000 | 4 |
Analysis. These terms balance breadth and specificity. The low competitiveness on “over ear headphones” and “gaming headphones” suggests under-investment in evergreen category pages that match intent (e.g., platform compatibility, mic quality, comfort over long sessions). The appearance of “wired headphones” reflects a counter-trend: users still want reliable, lossless or battery-free listening. For retail, that often means tidy wins on accessories and adaptors too.
Thought leadership. We’re watching a subtle return to control and practicality: USB-C wired, task-specific headsets, and TV soundbars tuned for dialogue clarity. Consumers frustrated by flaky Bluetooth and short battery life self-select into wired or hybrid products. Searchers want reassurance about compatibility and everyday ergonomics. Brands may need to consider intent-clustered navigation (“For running”, “For PC”, “For swimming”) and comparison content that makes trade-offs explicit.
Tip: If you want a deeper cut of the sector data, you can get the free 69-page report for the full tables and YoY movement.
Which brands lead digital brand awareness?
Brand awareness combines branded search demand with owned social reach. That shows who people look for by name and who can amplify content to their own audience. Below are selected leaders and prominent players.
Brand awareness — market leaders (brand searches + owned social)
| Rank | Brand | Brand searches / month | Owned social score |
|---|---|---|---|
| 1 | lg.com | 40,500 | 90,197 |
| 2 | razer.com | 40,500 | 32,200 |
| 3 | logitech.com | 60,500 | 8,338 |
| 4 | bose.co.uk | 49,500 | 9,941 |
| 5 | uk.jbl.com | 49,500 | 7,317 |
| 6 | sony.co.uk | 90,500 | 2,465 |
| 7 | steelseries.com | 33,100 | 5,842 |
| 8 | beatsbydre.com | 8,100 | 20,741 |
| 9 | skullcandy.co.uk | 33,100 | 4,934 |
| 10 | marshall.com | 60,500 | 2,994 |
| 11 | sonos.com | 60,500 | 2,527 |
| 12 | thomann.co.uk | 40,500 | 3,290 |
| 13 | sennheiser.com | 27,100 | 4,313 |
| 14 | uk.hyperx.com | 12,100 | 9,550 |
| 15 | uk.turtlebeach.com | 18,100 | 2,815 |
| 16 | andertons.co.uk | 74,000 | 558 |
| 17 | bowerswilkins.com | 40,500 | 782 |
| 18 | bang-olufsen.com | 4,400 | 3,500 |
| 19 | store.panasonic.co.uk | 27,100 | 518 |
| 20 | juno.co.uk | 40,500 | 340 |
| 21 | jabra.com | 12,100 | 1,015 |
| 22 | richersounds.com | 165,000 | 52 |
| 23 | ultimateears.com | 8,100 | 878 |
| 24 | denon.com | 5,400 | 1,147 |
| 25 | focusrite.com | 8,100 | 739 |
| 26 | uk.shokz.com | 9,900 | 502 |
| 27 | gear4music.com | 18,100 | 249 |
| 28 | uk.kef.com | 5,400 | 653 |
| 29 | shure.com | 4,400 | 687 |
Analysis. Household names unsurprisingly top branded demand (LG, Sony, Bose, JBL), but social-led gaming and creator brands (Razer, HyperX, SteelSeries) punch above their search weight by mobilising engaged communities. Beats remains a social powerhouse despite lower branded search than the hi-fi stalwarts. Richer Sounds shows exceptional brand recall relative to social scale — useful for SERP trust even when social visibility is modest.
Thought leadership. This blend of brand search and owned social underscores a simple truth: audiences don’t just find you; they look for you. For audio brands, that means creator-led awareness (Twitch, YouTube, TikTok) now sits alongside bricks-and-mortar trust. Expect younger cohorts to enter via social discovery and then search by brand; older cohorts invert that path. Brands may need to consider bridging the two journeys with consistent naming and the same answers (compatibility, warranty, returns) across product pages and social content.
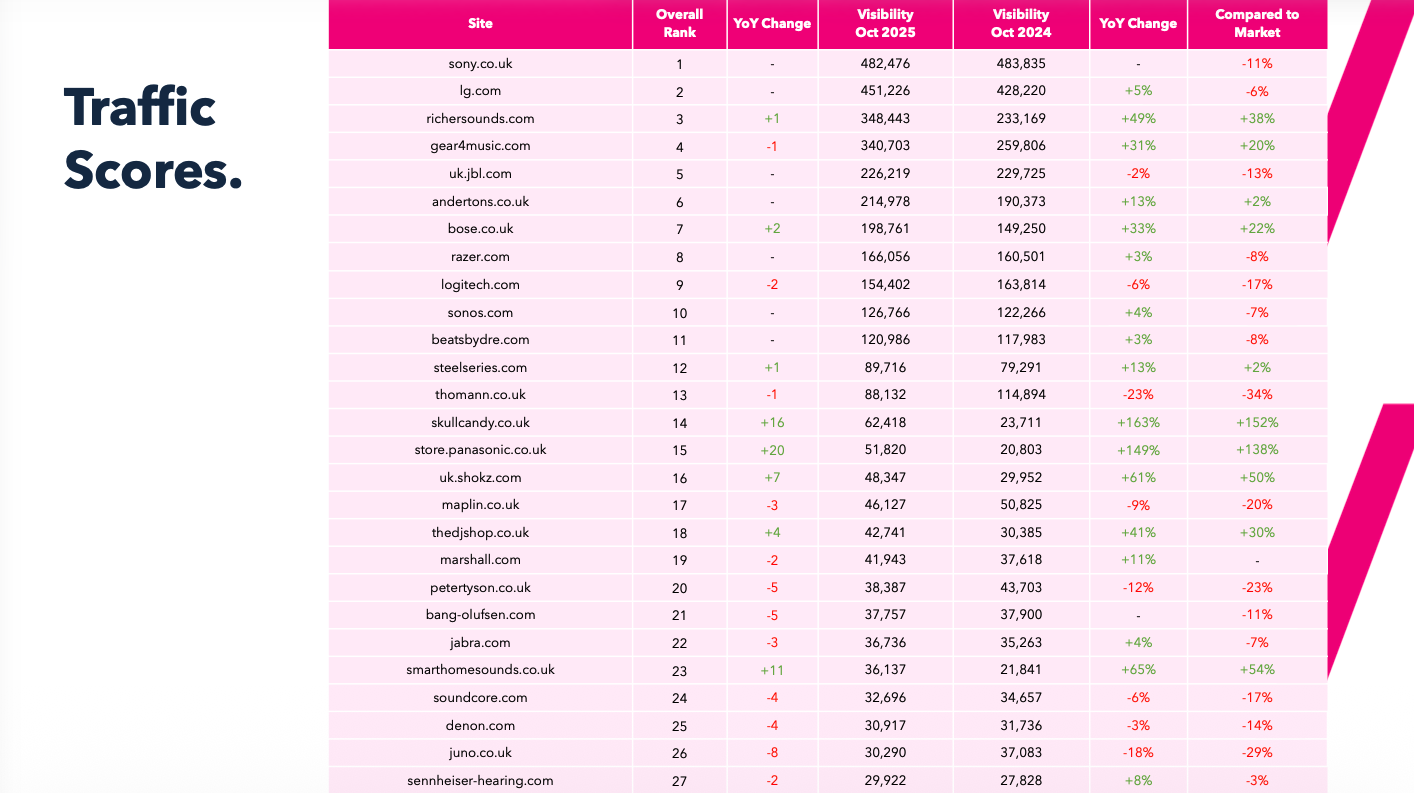
Who converts brand strength into organic traffic?
Plotting brand demand against organic traffic reveals four strategic positions. Here’s a condensed view of the “brand searches vs. traffic score” ordering in this sector.
Brand searches vs. traffic — relative ordering snapshot
- richersounds.com
- sony.co.uk
- andertons.co.uk
- logitech.com
- lg.com
- sonos.com
- uk.jbl.com
- bose.co.uk
- razer.com
- marshall.com
- thomann.co.uk
- steelseries.com
- skullcandy.co.uk
- gear4music.com
- juno.co.uk
- bowerswilkins.com
- store.panasonic.co.uk
- sennheiser.com
- maplin.co.uk
- harveynorman.co.uk
- uk.turtlebeach.com
- petertyson.co.uk
- audio-technica.com
- jabra.com
- beatsbydre.com
- soundcore.com
- uk.creative.com
- uk.shokz.com
- musicstore.com
- uk.hyperx.com
- cambridgeaudio.com
- focusrite.com
- denon.com
- ultimateears.com
- uk.kef.com
- bang-olufsen.com
- sevenoaks sound and vision
- shure.com
- westenddj.co.uk
- sennheiser-hearing.com
- caraudiocentre.co.uk
- smarthomesounds.co.uk
- rimmersmusic.co.uk
- audioaffair.co.uk
- thedjshop.co.uk
- futureshop.co.uk
- bax-shop.co.uk
- studiocare.com
- auna-multimedia.co.uk
- headset-store.co.uk
Analysis. Brands in the upper ranks typically balance strong branded demand with robust category visibility. Where we see gaps (e.g., decent traffic but weaker brand search, or the reverse), that points to mismatched investment: either SEO outpacing brand or brand outpacing SEO. Retailers with broad catalogues (Richer Sounds, Thomann, Gear4music) benefit from deep long-tail coverage, while product-led brands (Logitech, Razer, Sony) rely on launches and creator ecosystems to spike demand.
Thought leadership. This is the battleground for trust. Users will often scroll past a generic first result to click a known retailer or manufacturer. That behaviour intensifies as AI-written pages proliferate and shoppers seek familiar names. For challengers, the route to parity is to own a credible niche (e.g., “open-ear running headphones”) and build authority that compounds vertically, then expand sideways into adjacent categories.
Which sites win on review volume and score?
Reviews remain one of the strongest off-site trust signals and a visible CTR nudge when star ratings appear.
Review leaders (high-reviewed sites)
| Rank | Site | Reviews | Avg. score |
|---|---|---|---|
| 1 | sevenoakssoundandvision.co.uk | 118,825 | 4.9 |
| 2 | gear4music.com | 138,428 | 4.6 |
| 3 | audioaffair.co.uk | 6,153 | 4.9 |
| 4 | juno.co.uk | 50,812 | 4.8 |
| 5 | headset-store.co.uk | 3,807 | 4.9 |
| 6 | musicstore.com | 35,699 | 4.6 |
| 7 | audio-technica.com | 6,877 | 4.6 |
| 8 | petertyson.co.uk | 11,494 | 4.9 |
| 9 | focusrite.com | 5,400 | 4.6 |
| 10 | richersounds.com | — | — |
Analysis. Volume plus quality matters. Retailers with high review counts enjoy compound benefits: stronger local-pack presence for stores, persuasive social proof on PLPs/PDPs, and higher CTR when schema shows stars. Manufacturer sites with smaller counts still gain from quality; what they lack in volume they can offset with fast responses and visible guarantees.
Thought leadership. Consumers across age groups now expect review freshness and replies to negatives. That shifts the job from “collect reviews” to “maintain the conversation”. Brands may need to consider surfacing returns policies, warranties and troubleshooting up front — it reduces perceived risk and creates the confidence to commit at higher price points.
What do traffic vs. links tell us?
Comparing traffic score against referring domains sorts brands into four familiar quadrants.
- High traffic / high links. Dominant players with strong category coverage and brand equity.
- High traffic / low links. Technically sound sites with authoritative content but room to grow brand and digital PR.
- Low traffic / high links. Potential “sleeping giants” with legacy or low-quality links; fix technical debt and content architecture.
- Low traffic / low links. Early-stage or under-invested campaigns with scope to rebuild foundations.
Analysis. In audio, we often see large direct brands operating “high traffic / low links” because product ecosystems, firmware docs and communities fuel content value without as many PR-led links. Specialist retailers sometimes sit “low traffic / high links” after historical campaigns; consolidating old subdomains, rationalising cannibalised pages and refreshing internal linking often releases trapped equity.
Thought leadership. Links still matter, but relevance and technical quality weigh heavier than raw counts. For category growth, think in topics not products: “wireless surround sound for flats”, “USB-C wired earbuds for Android”, “open-ear running headphones for safety”. These clusters accrue authority faster than scattered product pushes.
Page experience still decides close races
Google still rewards fast, responsive pages, and every second counts. A one-second delay in load time can dent conversions.
Mobile product pages in this space carry heavy assets (lifestyle imagery, 3D, comparison tables). Prioritise LCP elements, keep JS lean, and remove any render-blocking experiments you don’t need.
Analysis. In a like-for-like SERP, the faster, clearer PDP usually wins the last click. Audio shoppers are comparison-heavy; they jump between spec sheets and reviews. Sites that make this effortless feel “trustworthy” before a single human interaction.
Thought leadership. Treat speed as part of brand: reliable, responsive, respectful of the user’s time. That message resonates across generations — older users who value clarity, and younger users who expect instant. It also compounds with review signals and branded recall.
Where is demand trending up (and why)?
The sector’s “emerging products” trends highlight practical, sometimes nostalgic, shifts:
- Record-player setups and speaker cables re-enter the mainstream alongside “smart speaker”.
- USB-C wired earphones, “wired earbuds” and “non wireless headphones” surge as users push back on flaky Bluetooth or missing headphone jacks.
- Fitness and safety use cases (“running headphones”, “bone conduction earphones”) keep growing steadily.
Analysis. Two worlds are colliding: convenience-led wireless ecosystems and control-first wired use. The resurgence of wired is not anti-tech; it’s anti-friction. For brands, this suggests category pages and buying guides that acknowledge trade-offs without judgement.
Thought leadership. Expect social discovery to keep shaping demand spikes (TikTok audio hacks, creator product picks). Retailers with flexible merchandising (bundles: USB-C dongle + wired buds; curated sets for vinyl starters) will meet people where they are.
Practical takeaways for 2025
- Balance brand and category. If your branded search grows faster than traffic, expand non-brand category coverage. If traffic grows but brand lags, invest in creator partnerships and digital PR that people actually notice.
- Build for use-cases. Cluster navigation and content around tasks: running, commuting, desk work, TV dialogue clarity, travel, sleep.
- Own review hygiene. Keep reviews fresh, reply fast, and surface guarantees on high-intent pages.
- Treat speed as UX. Prioritise LCP assets on product pages. Don’t let fancy scripts slow the thing people came to see.
- Ride wired’s comeback. Make it easy to shop USB-C wired options and explain benefits plainly.
Want to go deeper?
For the full dataset, winners/losers and YoY shifts, get the free 69-page report — the complete sector index with every table.
If you’d like help turning these insights into content that compounds, learn more about our content marketing service.
For a flavour of our approach in practice, see the Dreams case study showing how a content ecosystem can build long-term visibility.
Notes.
All brand names are presented in bold. Monthly search volumes are UK figures. Competitiveness is a relative score within the sector dataset. Brand searches and owned social represent combined digital brand awareness. Review counts and scores are shown as reported in the sector data. Where a site lacks a visible review score in the extract, the table shows an em dash.