


 10
10 2025 Luggage & Travel Accessories Industry Analysis – Search & AI Visibility
You’re reading my 2025 Luggage & Travel Accessories Industry Analysis: a practical, data-rich readout of how luggage brands are performing across branded search, generic demand, reviews, and—crucially—AI answer engines. I’ll show where attention clusters, where AI is redistributing it, and what that means for your next move.
Which luggage brands have the highest brand awareness online?
The sector’s brand awareness picture blends branded search with owned social reach. Below are the top market leaders measured on monthly UK branded searches and owned social footprint.
Table 1 — Brand Awareness: Market leaders
| Brand | Monthly brand searches (UK) | Owned social score | Rank |
|---|---|---|---|
| Mulberry | 90,500 | 2,446 | 1 |
| Samsonite | 40,500 | 3,890 | 2 |
| Kipling | 14,800 | 6,129 | 3 |
| Osprey | 74,000 | 1,219 | 4 |
| Rimowa | 40,500 | 1,902 | 5 |
| American Tourister | 12,100 | 3,700 | 6 |
| Eastpak | 14,800 | 2,391 | 7 |
| Mammut | 12,100 | 2,647 | 8 |
| TUMI | 14,800 | 2,110 | 9 |
| Anya Hindmarch | 22,200 | 1,035 | 10 |
What the table reveals
Brand recognition skews towards luxury-heritage names like Mulberry and Rimowa, paired with mass-market stalwarts such as Samsonite and American Tourister. Notice how Kipling’s social score outstrips its search volume, hinting at a community-led brand engine that could translate into future branded demand.
More interesting is Osprey—very high branded search, comparatively lean owned social. That mix suggests a strong product-led memory in consumers (people type the name when they need durable kit) rather than conversation-led salience. For brands with a similar profile, strengthening creator partnerships and reactive PR can convert that latent recognition into ongoing social proof.
Brand attention vs AI visibility — who tops searches and who tops AI?
We merged two lenses of brand awareness: branded search (people actively typing a brand) and AI visibility (how often brands show up in AI answers).
Table 2 — Brand Attention in search (exact-name monthly searches)
| Brand | Monthly searches |
|---|---|
| Osprey | 149,000 |
| Samsonite | 67,000 |
| Mulberry | 64,000 |
| It Luggage | 14,000 |
| Tripp | 6,200 |
| Antler | 5,400 |
| Luggage Superstore | ~20 |
Notes: We did not have a reliable exact-match figure for “Aero Lite Luggage”.
Table 3 — AI visibility (All platforms roll-up)
| Brand | Mentions | Citations (linked) | AI share of voice |
|---|---|---|---|
| Mulberry | 6,028 | 16 | 30.62% |
| Samsonite | 3,444 | — | 25.90% |
| Antler | 3,789 | — | 19.96% |
| Osprey | 3,780 | — | 17.30% |
| Tripp | 976 | 311 | 7.60% |
| It Luggage | 121 | 428 | 2.50% |
| Luggage Superstore | 11 | — | 0.31% |
| Aero Lite Luggage | — | — | 0.24% |
What the tables reveal
Search attention and AI attention aren’t the same thing. Osprey commands the largest branded search—people remember it at the moment of need—yet AI systems more frequently surface Mulberry and Samsonite. That tells us AI answer engines are weighting different signals (authority, editorial presence, topical coverage), not just raw popularity.
Antler is a standout. With modest branded search, its AI share is comparable to Osprey. This is a classic “over-performance” pattern: strong editorial coverage (e.g., evergreen luggage guides), brand mentions in third-party sources, and well-structured on-site content give AI models more reasons to include the brand in answers.
Citations are sparse overall but concentrated: It Luggage and Tripp win a disproportionate number of linked citations relative to mentions. That asymmetry implies these brands are earning links from sources AI trusts (buyers’ guides, airline policy explainers), a signal that can compound visibility in AI-first results.
Strategic take: Brands may need to consider mapping which answer types they want to win—pack-lists, airline size look-ups, materials advice—and then create evidence-rich pages with clear sourcing. AI engines reward clarity, coverage and corroboration.
What’s moving in consumer search — which product trends are rising or fading?
Consumer behaviour in luggage is tightly coupled to airline policies and practical constraints. The most explosive movers focus on dimension-driven intent.
Table 4 — Emerging product queries (12-month trend)
| Query | UK monthly searches | 12-month change |
|---|---|---|
| 40x30x20 cabin bag | 390 | +492% |
| 40 × 30 × 20 cm bag | 1,000 | +97% |
| 56 × 45 × 25 cm suitcase | 1,300 | +31% |
| 55 × 40 × 20 cm luggage | 720 | +32% |
| Airline hand luggage | 590 | +150% |
| Carry ons | 40,500 | +193% |
| Luggage roller | 480 | +122% |
| Luggage suitcase | 1,600 | +115% |
| Travel vacuum bags | 1,600 | +104% |
Table 5 — Receding product queries (12-month trend)
| Query | UK monthly searches | 12-month change |
|---|---|---|
| Suitcases | 201,000 | −28% |
| Luggage | 40,500 | −33% |
| Large suitcase | 49,500 | −18% |
| Cabin suitcase | 27,100 | −24% |
| Children’s luggage | 8,100 | −41% |
| Luggage store | 12,100 | −70% |
What the tables reveal
Demand is pivoting from generic to hyper-specific. People want the bag that fits their airline’s cage, not “a suitcase” in the abstract. That’s a behaviour change worth leaning into. When travellers search “40×30×20”, they’re closer to purchase than someone typing “luggage”. Brands that structure navigation around these constraint-led needs—size filters, airline-fit badges, dimension-first PLPs—will convert better and feed the right signals back into search.
The receding terms aren’t a decline in interest so much as a re-allocation. As consumers learn to search with specificity, generic head terms lose share. That’s also why we see AI answers gravitating to brands with hub-and-spoke explainer content on materials, weights, and airline sizing—there’s more to cite, more to trust, and more user intent satisfied on-page.
High-competition vs opportunity keywords: where should attention go?
Table 6 — High-competition luggage keywords
| Keyword | UK monthly searches | Competitiveness |
|---|---|---|
| Suitcases | 38,000 | 28 |
| Luggage | 24,000 | 61 |
| Hand luggage | 11,000 | 46 |
| Carry on luggage | 5,700 | 26 |
| Travel suitcase | 2,500 | 44 |
Table 7 — Opportunity keywords (lower competition, solid volume)
| Keyword | UK monthly searches | Competitiveness |
|---|---|---|
| Cheap luggage | 700 | 5 |
| 20 kg suitcase | 700 | 5 |
| Cabin suitcase sale | 700 | 6 |
| 10kg hand luggage | 800 | 10 |
| Small suitcase on wheels | 2,700 | 7 |
| Electric suitcase | 900 | 10 |
What the tables reveal
The high-comp terms are brand-builder slots—great for Samsonite-type incumbents but expensive to defend. The “opportunity” set sits closer to need states (budget, weight limits, wheels). These aren’t vanity rankings; they’re conversion-adjacent. If you’re Antler or Tripp, winning five of these can beat a single top-three on “luggage”.
Also note how the opportunity terms align with the emerging-trend table. That overlap is your editorial roadmap: produce size- and weight-led buying content now; amplify it with PR that earns citations in airline-policy explainers and travel press round-ups.
Reviews and trust — which sites signal credibility best?
For e-commerce in this category, review footprint correlates with click-through rate and conversion. Here’s a snapshot of review profiles across well-known retailers and brands.
Table 8 — Review footprint (score & volume)
| Site | Reviews (count) | Review score |
|---|---|---|
| Case Luggage (caseluggage.com) | 4,231 | 4.7 |
| Tripp (tripp.co.uk) | 2,627 | 4.4 |
| London Luggage (londonluggage.co.uk) | 2,438 | 4.9 |
| It Luggage (itluggage.com) | 5,290 | 4.1 |
| Go Places (goplaces.co.uk) | 1,565 | 4.9 |
| Luggage Superstore (luggagesuperstore.co.uk) | 1,608 | 4.6 |
| Antler (antler.co.uk) | 2,921 | 4.4 |
| Elizabeth Scarlett (elizabethscarlett.com) | 868 | 4.7 |
What the table reveals
Trust cues remain decisive for high-consideration items. Notice how specialist retailers like Case Luggage and Go Places post sky-high scores; that consistency feeds product-page schema, star snippets, and confidence at checkout. Conversely, a high review count with a middling score (e.g., It Luggage) can depress conversion unless the most recent feedback is visible and answered.
On the AI side, third-party reviews and authoritative guide links act as “evidence”. When you see It Luggage and Tripp over-indexed on AI citations, it’s likely because their products or retailers are frequently referenced by sources that AI models trust. That’s a signal to prioritise review syndication and expert-led content in places journalists cite.
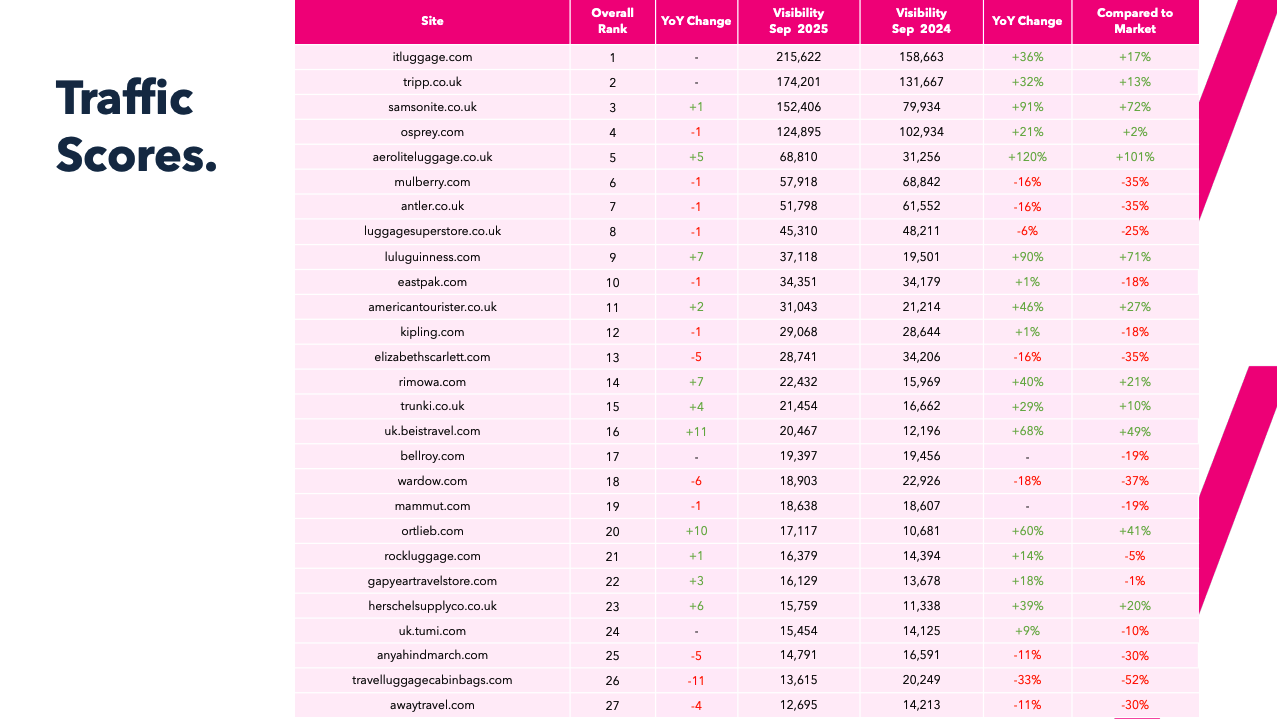
Market visibility and volatility — who’s moving?
The market’s average visibility rose this year (+19%). Beneath that surface, volatility is high, with smaller players swinging hardest.
Table 9 — Notable movers (traffic score YoY)
| Site | YoY change |
|---|---|
| Nomad Luggage (nomadluggage.co.uk) | +3,000% |
| Move With Carlton (movewithcarlton.com) | +478% |
| Burkely (burkely.com) | +330% |
| Horizn Studios (horizn-studios.com) | −100% |
| Myleatherbag (myleatherbag.co.uk) | −97% |
What the table reveals
This is a classic long-tail shake-up. Challenger sites can capture meaningful share quickly with the right cluster strategy (airline sizes, cabin weight, materials) and a review-led trust stack. But the downside risk is real—JavaScript-heavy rebuilds and indexation slip-ups can erase years of equity overnight, as seen with Horizn Studios.
Putting it all together: directional plays for 2025
Here’s my read on what the data is telling us—kept deliberately directional so you can adapt it to your brand and resourcing.
- Shape for airline-fit search. Group navigation and content by airline-size constraints (40×30×20, 56×45×25, 10 kg, 23 kg). Add visual size badges site-wide. This matches how users search and how AI summarises.
- Win answer types, not just keywords. Decide which “entity-answers” matter: size rules, materials, durability tests, lock types. Build evidence-rich pages with schema, diagrams, and references. That’s how Antler-style AI visibility happens despite lower branded