


 10
10  1-100
Brands Ranked
1-100
Brands Ranked 2025 Cycling Industry Analysis
Buying a new bike isn’t a tap‑to‑buy decision. It’s researched, test‑ridden, financed, fettled and often discussed with riding mates. That long, high‑consideration journey shows up in search: more queries, comparisons, and questions.
This 2025 Cycling Industry Analysis distils what we found in the Salience Index for UK cycling. Who’s visible, which keywords are rising or fading, and how brand signals shape outcomes.
I’ll call out the Canyon spotlight too — not for topping every chart, but for a journey that’s simply fantastic. Get the free 69‑page report via our landing page if you want the complete data set.
Which cycling brands dominate organic visibility?
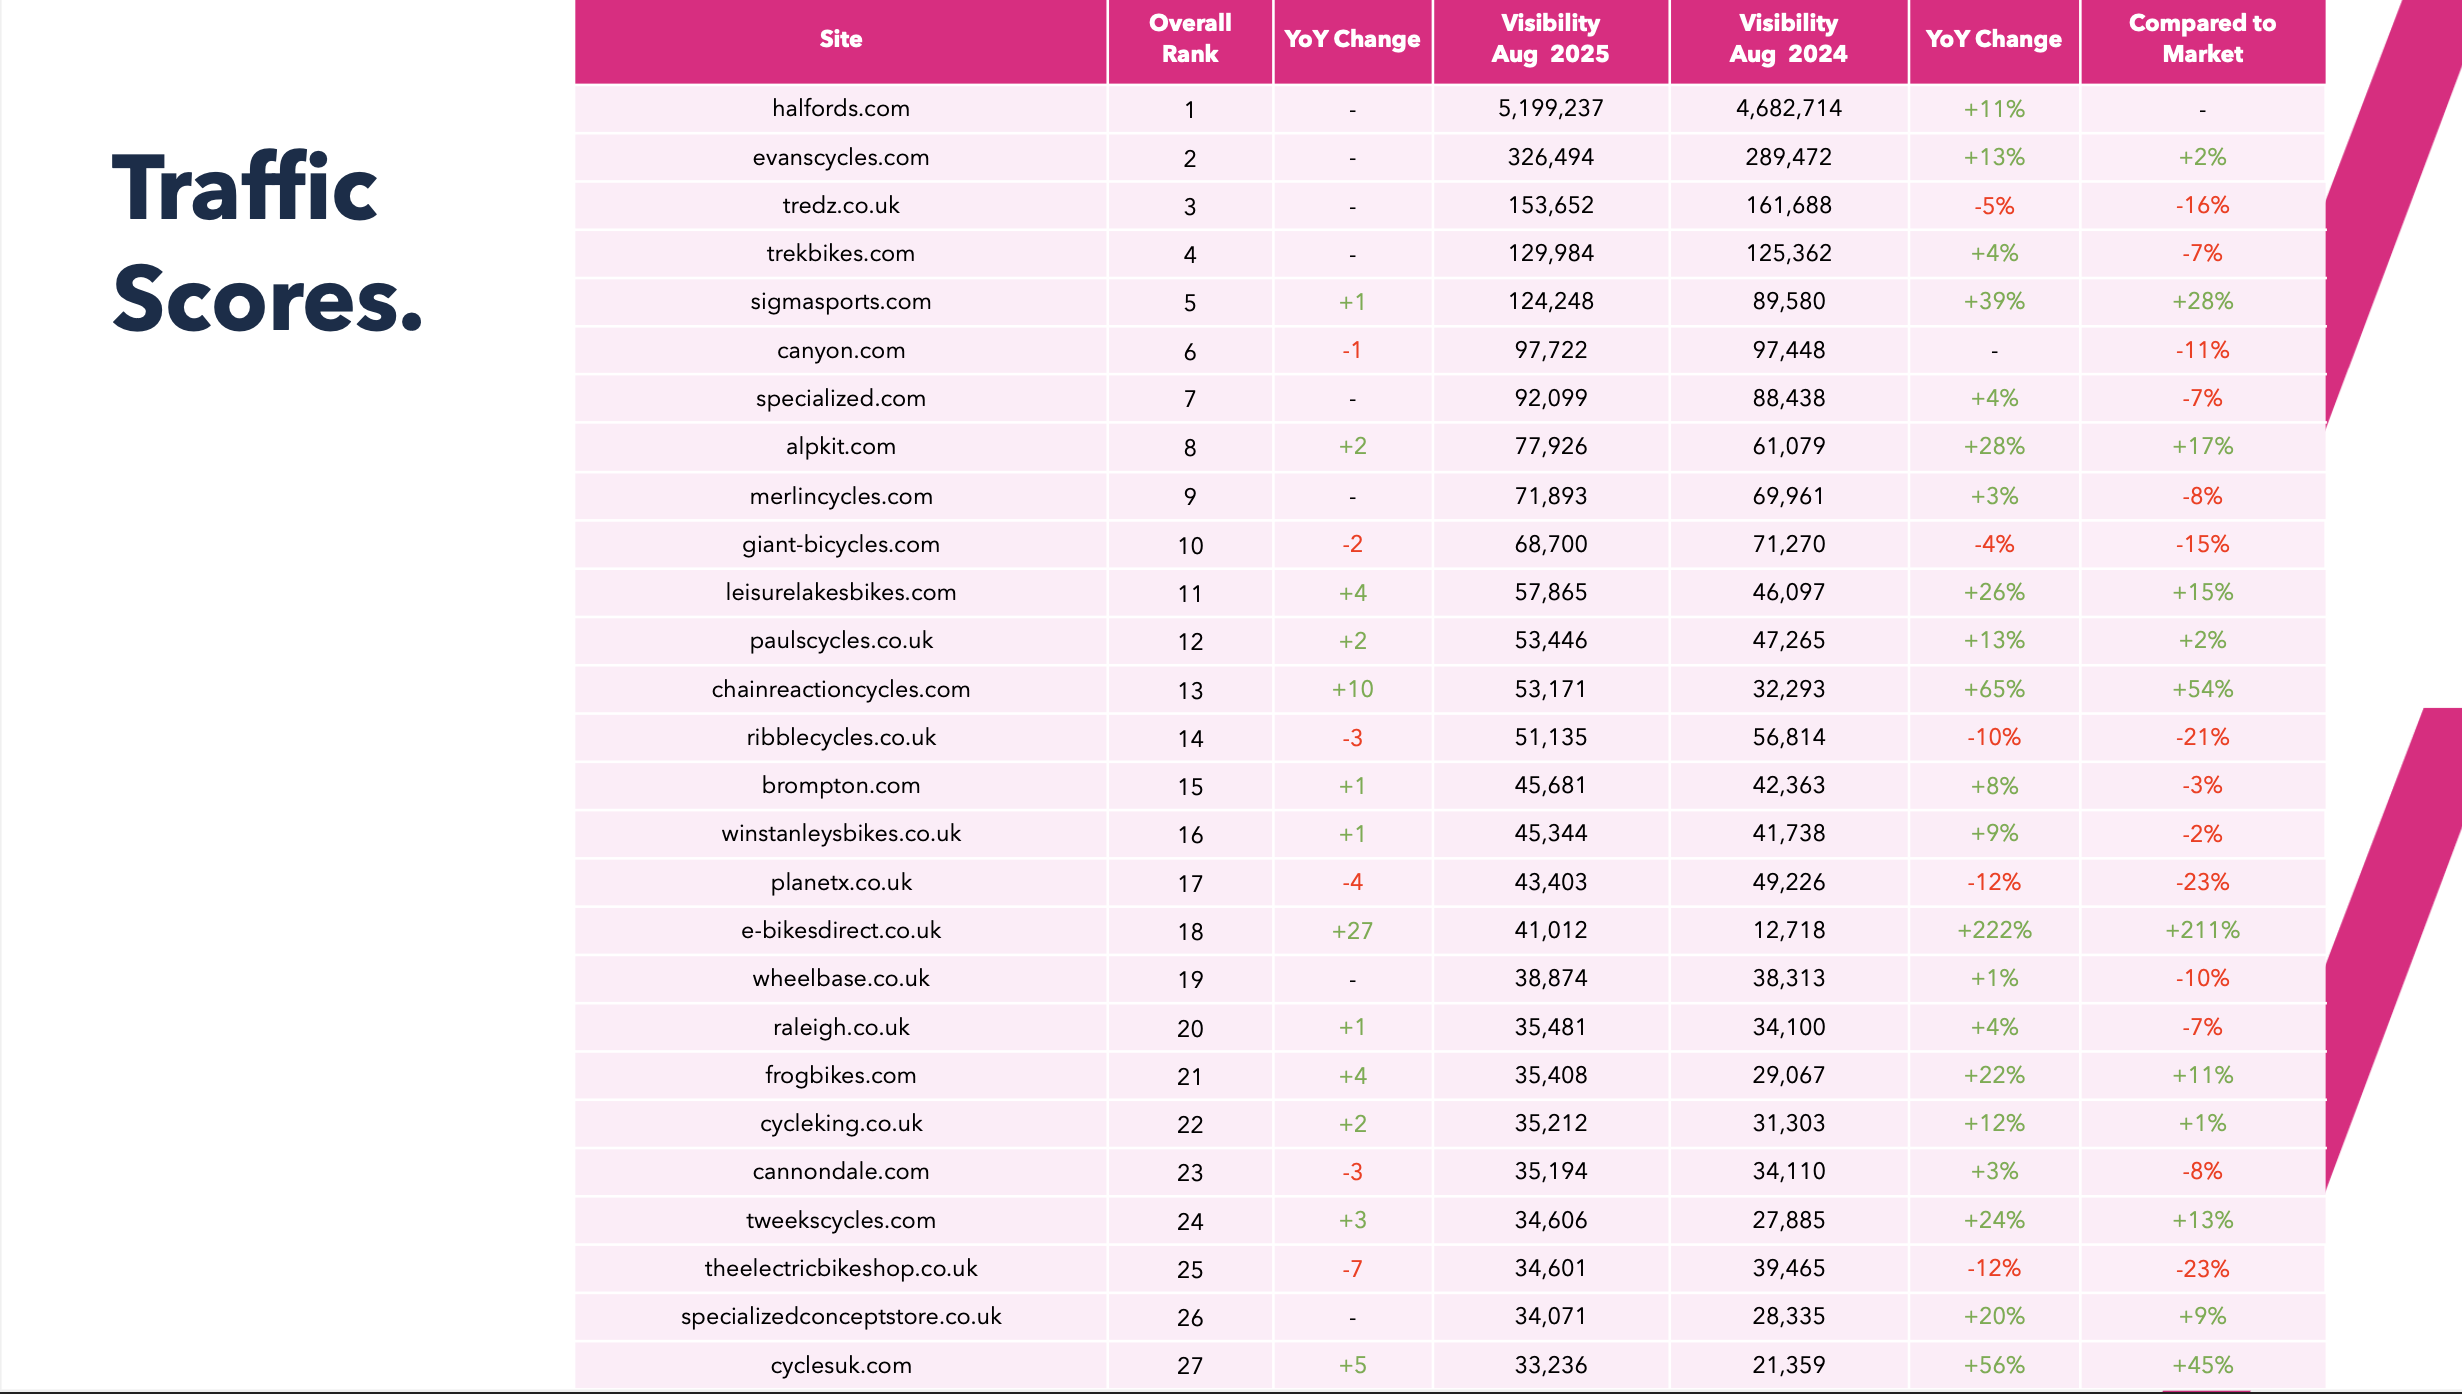
Below is the upper end of the traffic‑score table (Ahrefs‑based), showing estimated organic traffic across August 2025 vs August 2024 and the YoY change.
| # | Brand / Site | Traffic Score (Aug ’25) | Traffic Score (Aug ’24) | YoY |
|---|---|---|---|---|
| 1 | Halfords (halfords.com) | 5,199,237 | 4,682,714 | +11% |
| 2 | Evans Cycles (evanscycles.com) | 326,494 | 289,472 | +13% |
| 3 | Tredz (tredz.co.uk) | 153,652 | 161,688 | −5% |
| 4 | Trek (trekbikes.com) | 129,984 | 125,362 | +4% |
| 5 | Sigma Sports (sigmasports.com) | 124,248 | 89,580 | +39% |
| 6 | Canyon (canyon.com) | 97,722 | 97,448 | ~0% |
| 7 | Specialized (specialized.com) | 92,099 | 88,438 | +4% |
| 8 | Alpkit (alpkit.com) | 77,926 | 61,079 | +28% |
| 9 | Merlin Cycles (merlincycles.com) | 71,893 | 69,961 | +3% |
| 10 | Giant (giant-bicycles.com) | 68,700 | 71,270 | −4% |
Industry variance: +11% — average change in visibility across the market. A double‑digit variance signals fluidity in rankings and buyer intent.
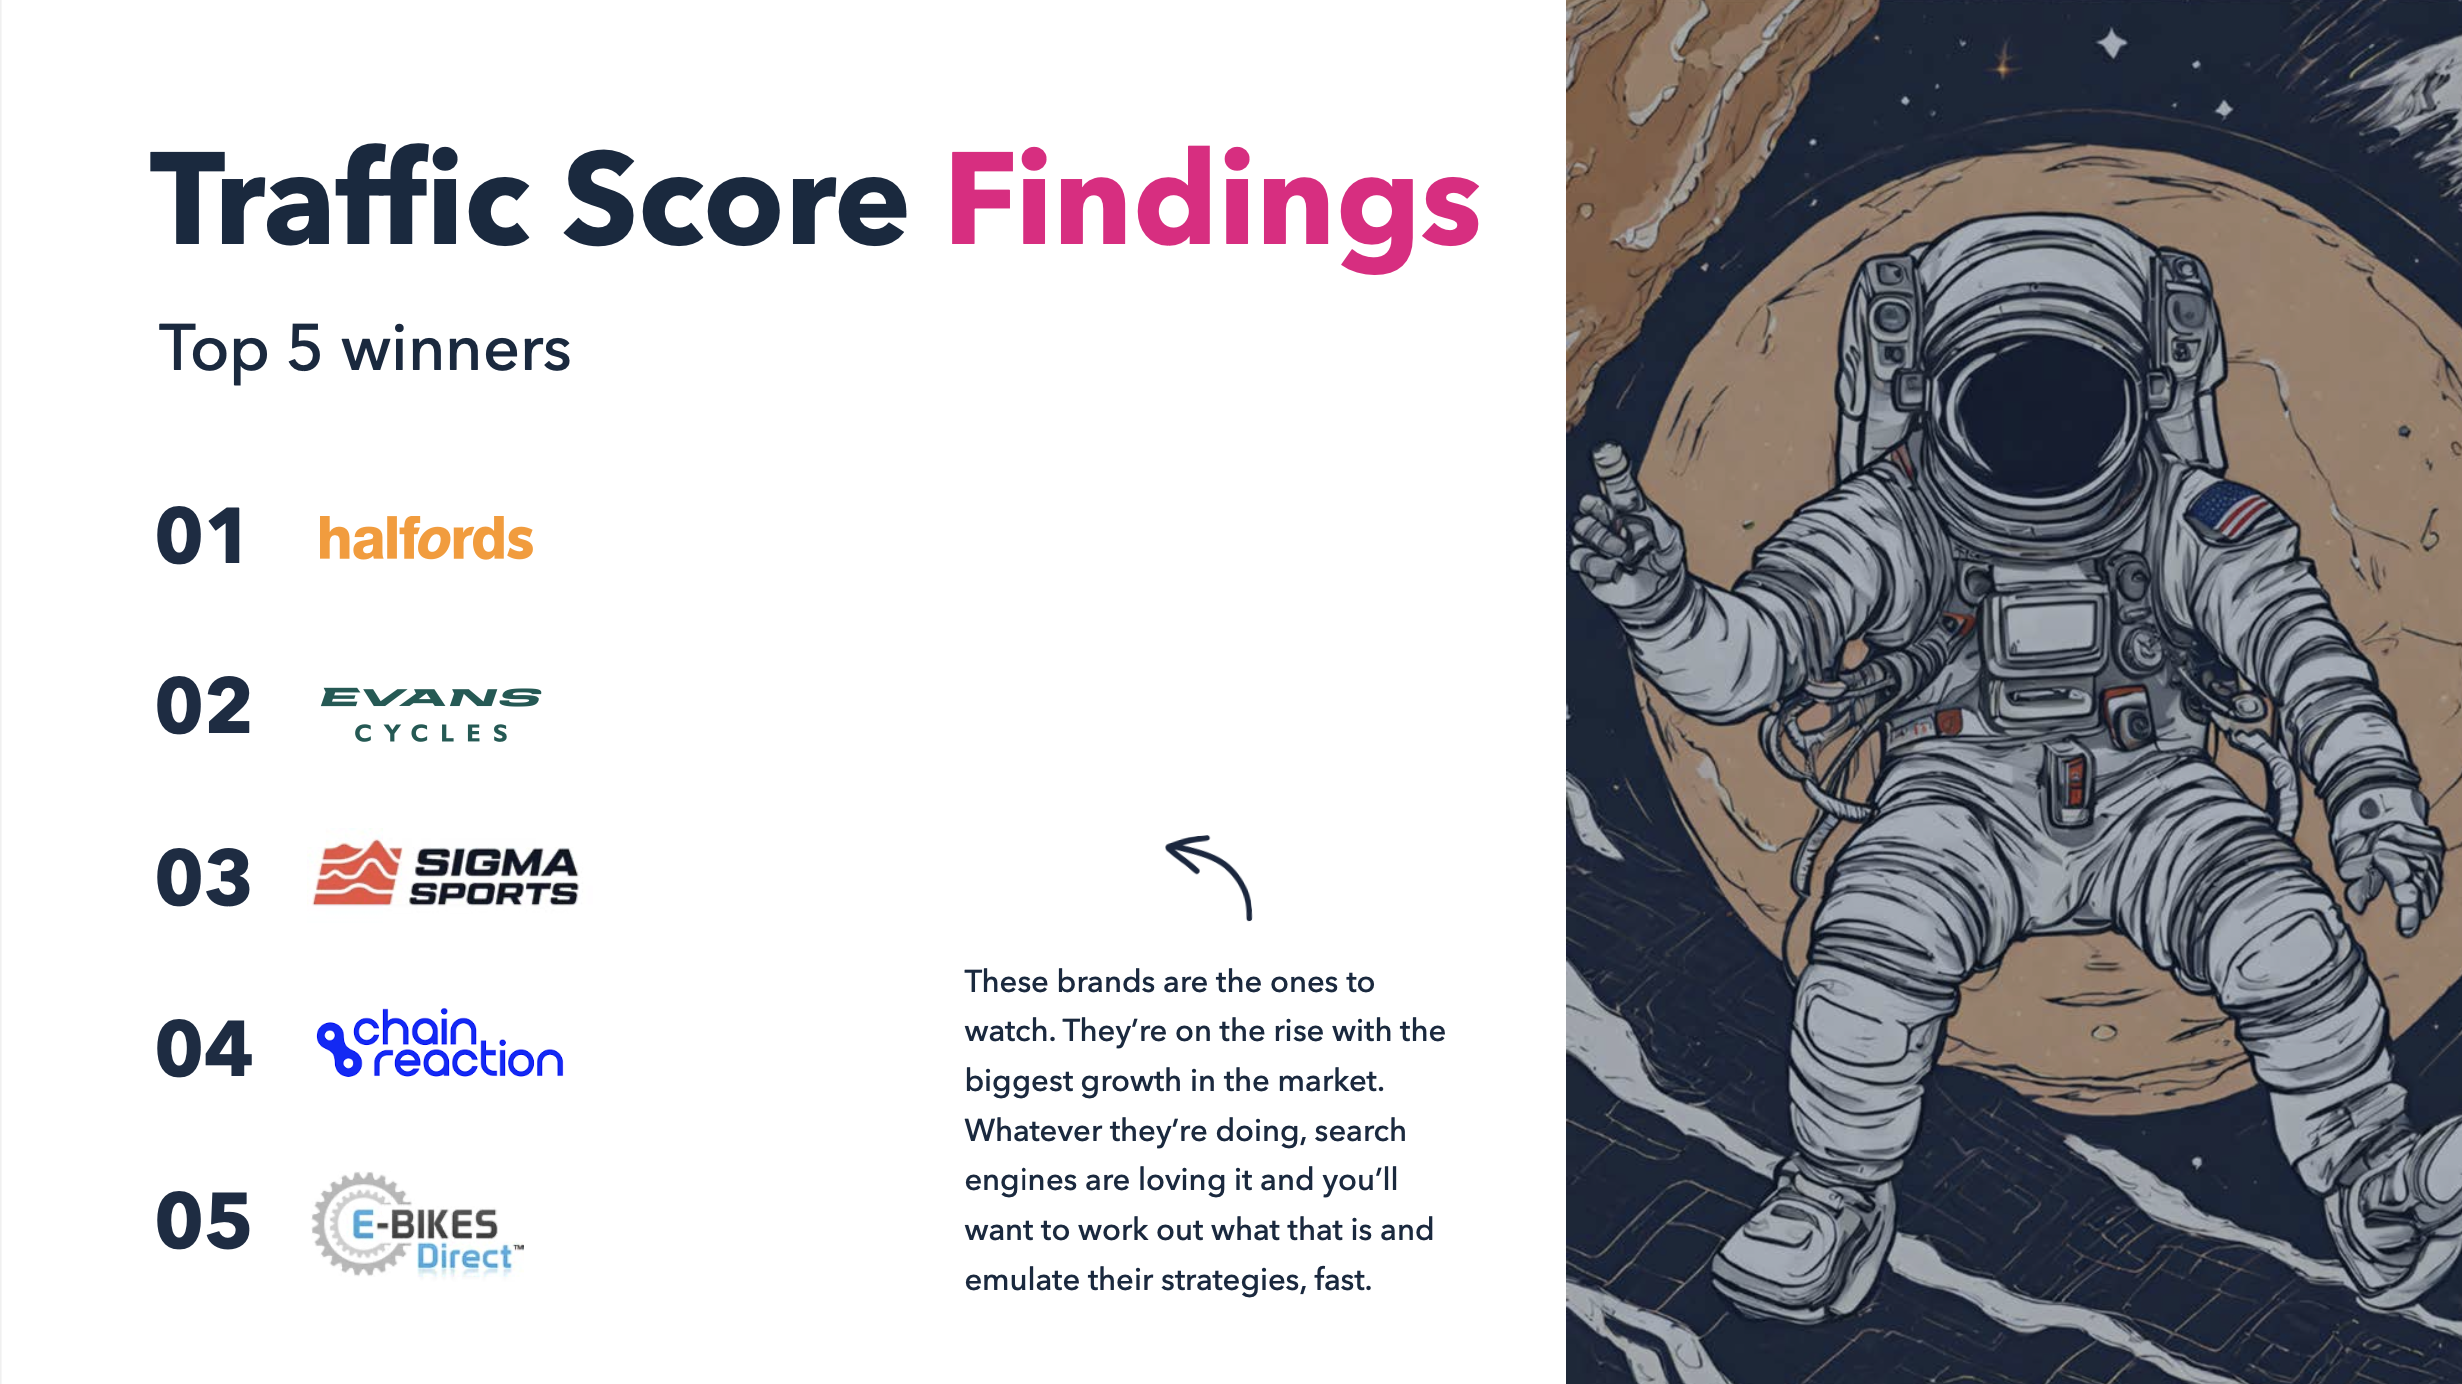
Market leaders diverge. Halfords continues to dominate thanks to catalogue breadth and SERP reach, while Evans Cycles and Sigma Sports show healthy momentum.
Segment matters. Multi‑brand retailers (Halfords, Evans Cycles, Tredz, Sigma Sports) play differently from D2C manufacturers (Trek, Specialized, Canyon, Giant). Retailers win on category depth and high‑volume queries; D2C brands win when they own topical clusters and long‑tail intent.
Split your strategy. If you’re a retailer, build comparison guides and capture high‑volume head terms. If you’re a manufacturer, invest in content clusters around “best endurance frames”, “women’s gravel fit” and similar job‑to‑be‑done keywords.
Which cycling brands have the strongest digital brand awareness?
We blend branded search demand with owned social reach to model “brand awareness” across the sector. Here are the leaders:
| # | Brand / Site | Monthly Brand Searches | Owned Social Score |
|---|---|---|---|
| 1 | Halfords (halfords.com) | 2,240,000 | 665 |
| 2 | Specialized (specialized.com) | 33,100 | 5,712 |
| 3 | Canyon (canyon.com) | 27,100 | 3,612 |
| 4 | Chain Reaction Cycles (chainreactioncycles.com) | 40,500 | 2,198 |
| 5 | Trek (trekbikes.com) | 22,200 | 3,783 |
| 6 | Evans Cycles (evanscycles.com) | 135,000 | 391 |
| 7 | Cube (cube.eu) | 33,100 | 1,228 |
| 8 | Cannondale (cannondale.com) | 12,100 | 2,155 |
| 9 | Tredz (tredz.co.uk) | 74,000 | 172 |
| 10 | Brompton (brompton.com) | 27,100 | 469 |
Two archetypes emerge. Retailers like Halfords, Evans Cycles and Tredz have massive brand recall, while performance marques such as Specialized, Canyon, Trek, Cannondale and Cube rally engaged fan bases.
Owned social cushions volatility. Performance marques over‑index on social reach; those active communities insulate them from algorithm shifts by sustaining demand that doesn’t rely on generic SERPs.
Fuse brand and generic search. When brand search is high but generic visibility lags, create category hubs that convert brand interest into discovery journeys (“enduro bikes”, “gravel forks”). If social is strong but search volumes smaller, build evergreen guides that connect community content to Google‑indexed answers.
Who has the most substantial social proof?
A sample of the most‑reviewed cycling retailers and manufacturers, with average ratings:
| Brand / Site | Reviews | Avg. Rating |
|---|---|---|
| Chain Reaction Cycles (chainreactioncycles.com) | 148,257 | 4.2 |
| Tredz (tredz.co.uk) | 89,320 | 4.6 |
| SJS Cycles (sjscycles.co.uk) | 78,300 | 4.8 |
| Sigma Sports (sigmasports.com) | 43,568 | 4.8 |
| Canyon (canyon.com) | 43,053 | 4.4 |
| Ribble Cycles (ribblecycles.co.uk) | 38,334 | 4.5 |
| Tweeks Cycles (tweekscycles.com) | 25,538 | 4.8 |
| Balfes Bikes (balfesbikes.co.uk) | 18,758 | 4.7 |
| Planet X (planetx.co.uk) | 14,847 | 4.7 |
Social proof accelerates conversion. On big‑ticket purchases, human validation matters. Review volume and sentiment guide shoppers and signal trust to search engines.
Chain Reaction Cycles, Tredz and SJS Cycles combine huge review counts with solid ratings; they’ve earned credibility. The higher the average rating, the more margin you get to experiment in SERPs.
Integrate reviews into mid‑funnel content. Don’t hide ratings on product pages. Pull snippets and owner quotes into guides, comparison tables and category hubs to build confidence mid‑journey.
Cycling keyword trends: what’s growing, what’s fading?
Emerging product queries
- “folding bike bags” — 2,900 monthly searches; up +569%
- “dirt jump” — 5,400; +139%
- “pedal assist electric bike” — 1,000; +125%
- “cheap full suspension mountain bikes” — 1,900; +109%
- “full suspension” — 1,900; +85%
- “full face mountain bike helmet” — 8,100; +49%
- “affordable electric bike” — 9,900; +50%
Emerging brand queries
- Cube — 33,100; +22%
- Canyon — 27,100; +15%
- Trek — 22,200; +31%
- Winstanleys Bikes — 18,100; +22%
- Balfes Bikes — 14,800; +7%
- Cannondale — 12,100; +7%
- Condor Cycles — 9,900; +14%
Receding product queries
- “bicycle shop” — 110,000; −49%
- “road bicycle” — 27,100; −12%
- “gravel bicycle” — 27,100; −12%
- “kids bikes” — 33,100; −7%
- “cycling helmet” — 9,900; −18%
Receding brand queries
- Halfords — 2,240,000; −6%
- Evans Cycles — 135,000; −7%
- Chain Reaction Cycles — 40,500; −53%
- Merlin Cycles — 33,100; −18%
- Specialized — 33,100; −12%
- Wheelbase — 12,100; −18%
- Raleigh — 12,100; −13%
E‑bikes and MTB kit lead the surge. Rising queries cluster around e‑bike safety, full‑suspension upgrades and dirt‑jump disciplines — riders are trading up components, protecting themselves better and experimenting with new disciplines.
Generic storefront queries are fading. Searches like “bicycle shop” drop as users go solution‑first: they research by job‑to‑be‑done and then choose the seller. Your category page, comparison table and fit guide are now the front door.
Meet users where they are. Younger riders discover via social, then hit Google with specific questions. Answer those questions quickly and clearly — or lose the click to someone who does.
How search behaviour is changing across road, MTB and e‑MTB
Road used to dominate the generic head terms. Now, growth congregates in MTB kit, protection and e‑MTB accessories. Riders ask less “which bike?” and more “how do I ride better, safer, farther?”.
E‑MTB queries show more practical intent: charging, battery care, drivetrain wear and brake upgrades. These are perfect for solving with short, confident paragraphs and visuals. The conversion path is different too — a forum‑primed user lands on a guide first, not a product page.
If your guide is designed to convert (clear options, in‑context reviews, finance explainer, shoppable content), that session can become revenue too.
High‑competition keywords: the head terms everyone fights for
| Keyword | UK Monthly Searches | Competitiveness |
|---|---|---|
| bicycle | 24,000 | 86 |
| bikes | 20,000 | 57 |
| ebike | 25,000 | 47 |
| bike shop near me | 18,000 | 68 |
| cycle shop near me | 4,100 | 71 |
| mountain bikes | 7,900 | 22 |
| bike lights | 7,600 | 21 |
| bike parts | 3,800 | 58 |
| push bike | 3,400 | 53 |
| electric bikes for sale | 4,200 | 42 |
Head terms still matter, but… They’re crowded. SERP features and shopping carousels squeeze click‑through rates. Head terms are great for reach; not always for revenue.
Qualify intent fast. To turn head‑term visits into wins, answer users’ first three questions without scrolling: size guides, range finders, comparison content.
Trust and user experience convert. Pull reviews into mid‑journey pages, clarify warranties and finance, use tidy internal links. Invest as much in landing template UX as in ranking content.
Method notes: how we calculate Traffic Score
Traffic Score totals the estimated traffic a domain earns from all keywords it ranks for, based on rank positions, monthly volumes and position CTR models. It’s not your analytics; it’s a consistent proxy for growth and share. The job isn’t to obsess over the absolute number — it’s to spot direction, volatility and gaps between you and the market.
What this means for your 2025 plan
To keep this actionable, here are directional moves the data points toward:
- Shift from store‑first to solution‑first journeys. Treat category and comparison pages as your true homepage. Make specifications human, not just technical.
- Lean into rising e‑bike and MTB safety queries. Build accessory clusters and service pages that solve adjacent jobs — chargers, pads, helmets, drivetrain wear, suspension servicing.
- Fuse brand and generic search. High brand search + weak generic rankings = a gap in your category architecture and internal linking.
- Make reviews do real work. Pull rating snippets and owner quotes into mid‑funnel content, not just product pages.
- Win the click, then win the session. If you must chase head terms, ensure landing templates answer users’ first three questions without scrolling. Tie trust elements into the design, then keep users in the journey with tidy internal links.