Need more value from search? Book a free discovery call 📞
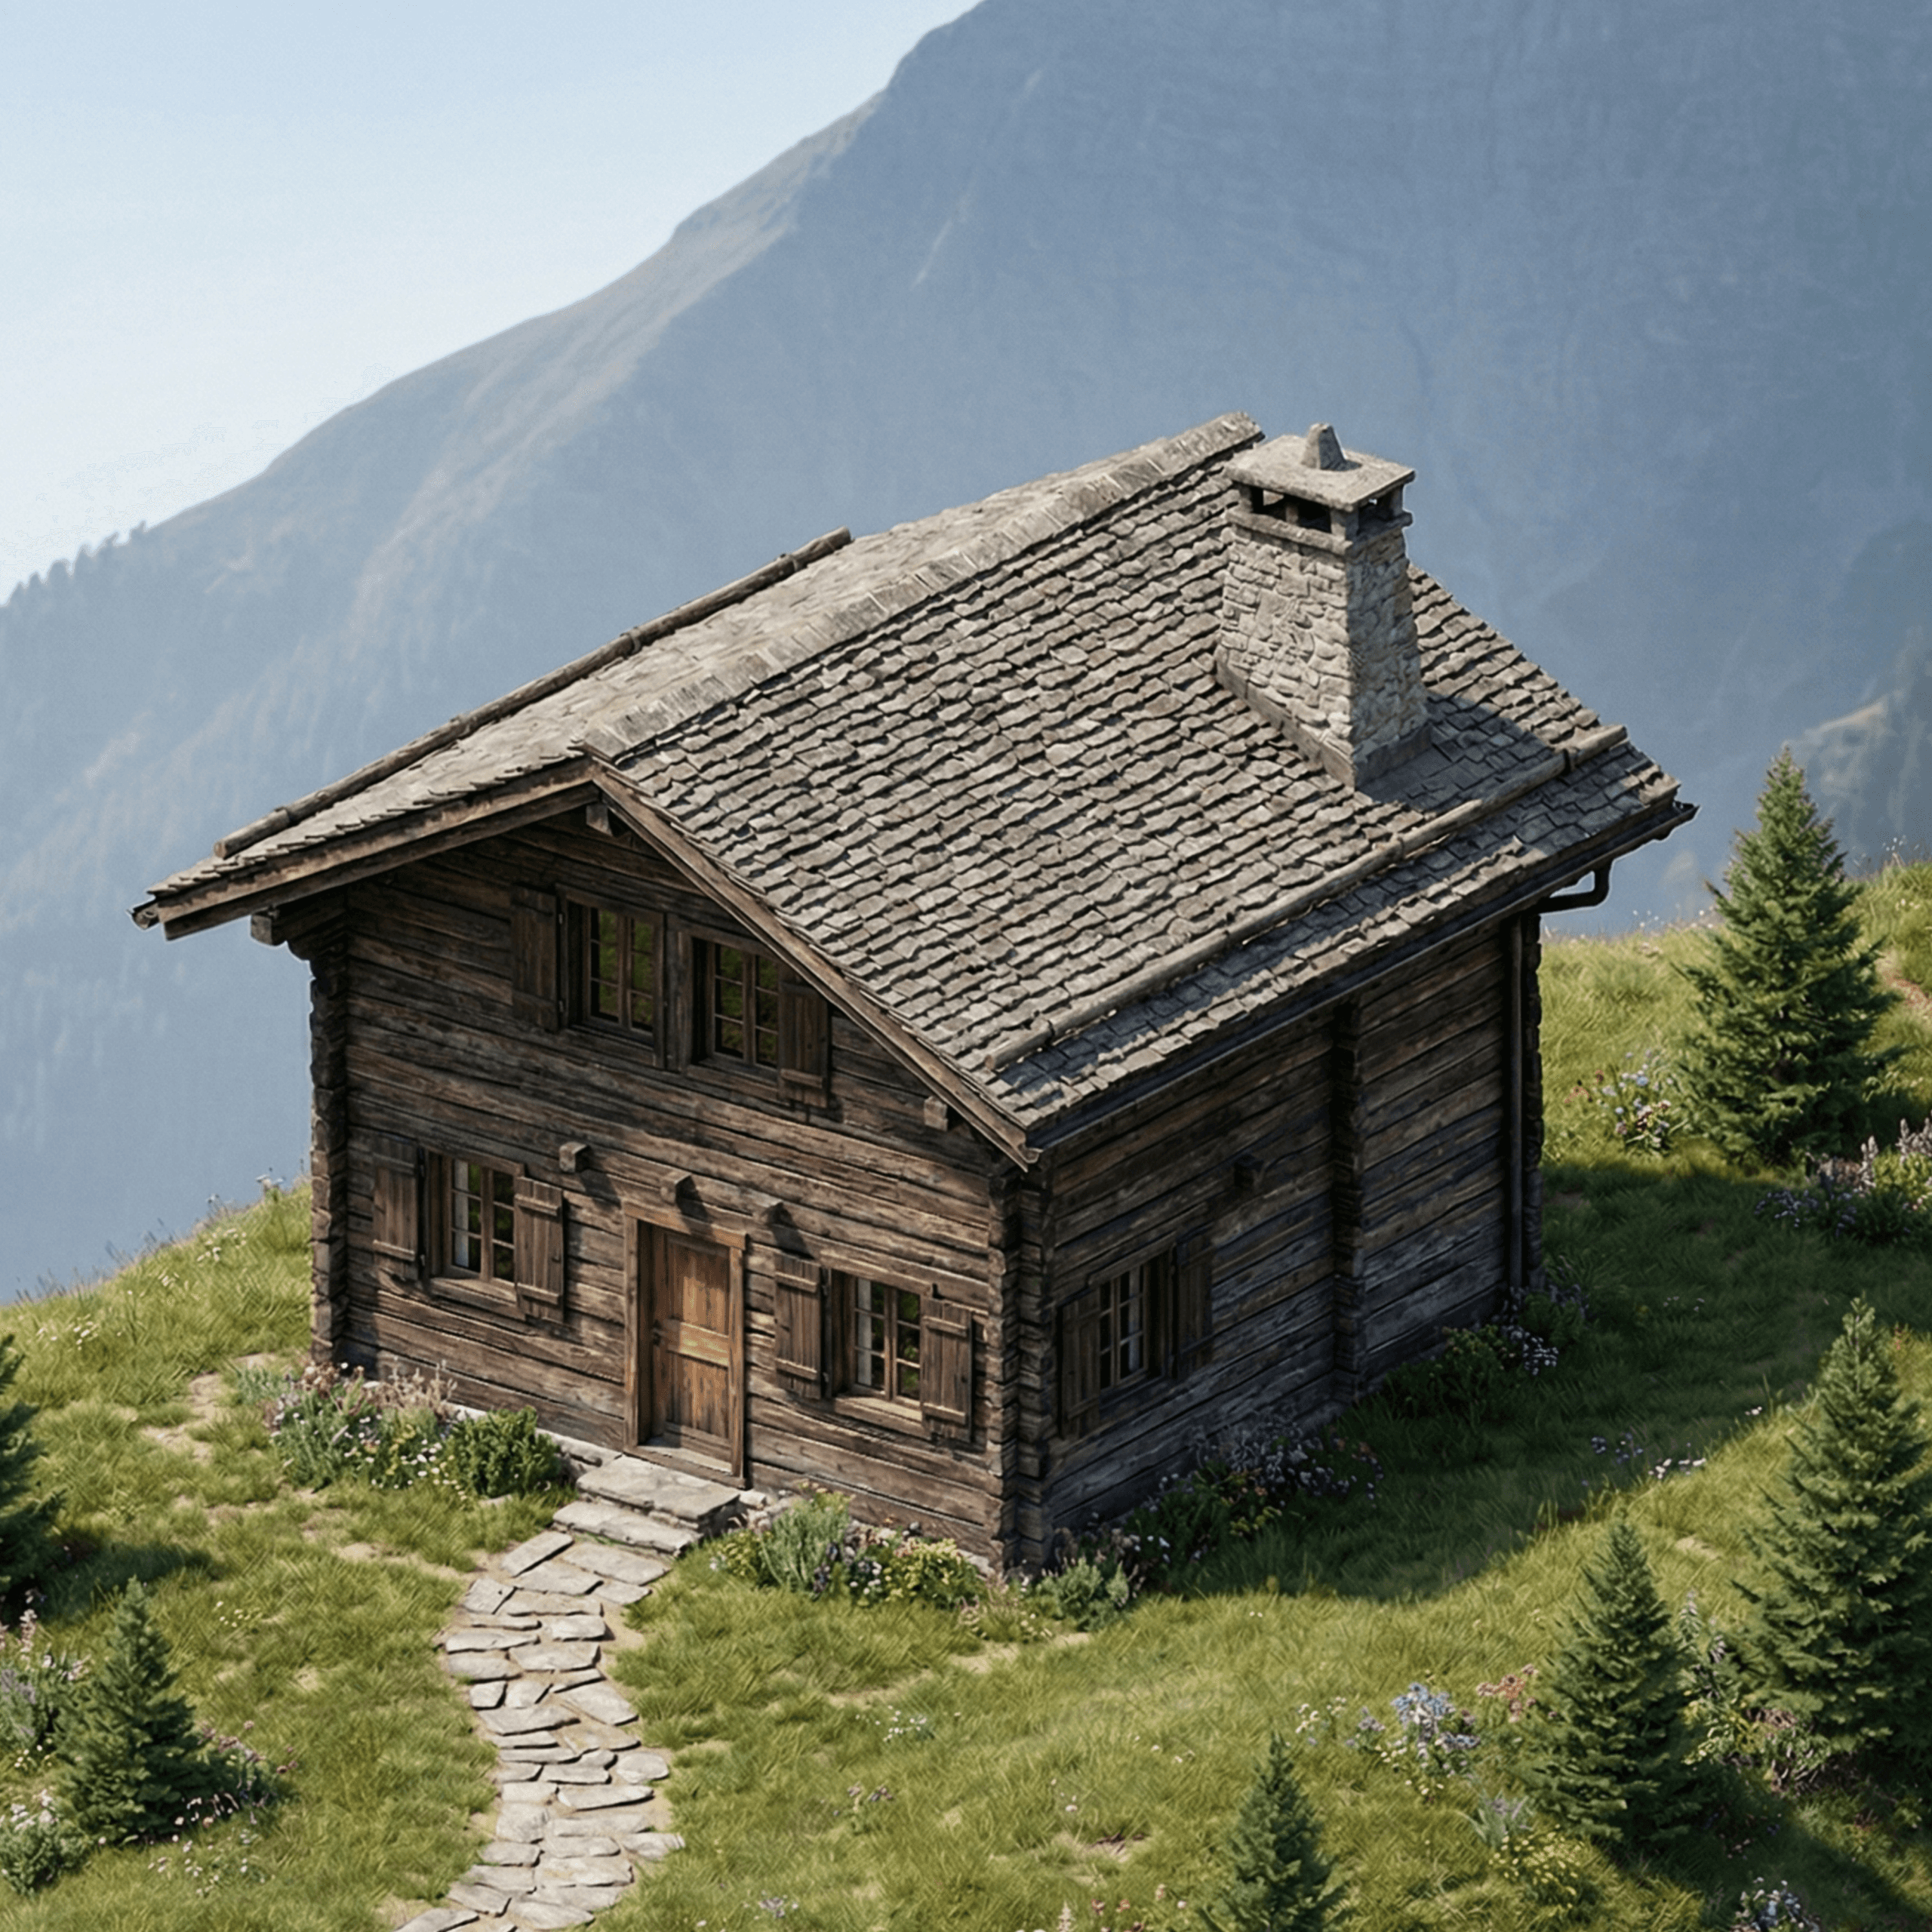
Rustic wooden cabin in a mountainous landscape, surrounded by wildflowers and pine trees.
UPDATED AUG 2026
100+

Brands Ranked

69

Pages

9,800

Keywords

10

Min Read

100+ Brands Featured

Hoseasons brand logo with navy lettering and leaf accent
Sykes Holiday Cottages logo with circular house roof symbol in navy
Holiday Cottages logo featuring house icon and UK domain
Cottages.com logo with line-drawn house icon and domain name
Forest Holidays travel brand logo with sun and feather leaf design
Hot Tub Hideaways company logo featuring water wave shield design
Last-Minute logo with lowercase e in dark navy house shape
Historic UK heritage accommodation guide logo with blue decorative shield emblem
Holiday Lettings vacation rental property logo with house icon
Cornish Cottage Holidays logo in navy and white with script lettering
-19.00%

Market visibility

+118k

Biggest visit gain

1.2m

Market traffic loss

Our reports have been the UK’s No.1 search marketing benchmark for the last 10 years! Marketing decision makers spanning 60 sectors have downloaded our reports to save over 72 hours of research and discover exactly how their brand ranks against the competition in search, visibility, and growth potential.

I was extremely impressed with the insight and depth of analysis in the Salience Report... The data-driven analysis tracking visibility, authority, links, page speed, search volume, keywords, and more paints a detailed picture of brand performance and emerging trends. The team was delighted to be featured.

The Salience Holiday Cottages Index

The UK's No.1 Holiday Cottages Industry Report

FREE
DOWNLOAD

Across the 310 brands tracked in this index, organic search visibility fell 19.00% between June 2025 and June 2026. We checked that figure a second way, by summing the monthly traffic on every domain in the published 100-domain table: 6,372,635 monthly visits in June 2025 against 5,117,524 in June 2026, a fall of 1,255,111 monthly visits, or 19.70%. Two independent methods landing 0.70 percentage points apart means the contraction is real rather than an artefact of which brands happen to sit in the sample.

The decline runs right across the sector. Of the published top 100 domains, 65 lost visibility year on year, 32 grew and 3 finished effectively flat. That breadth changes how you should read your own numbers. A UK holiday let brand that finished the year down 15% has outperformed the market by four percentage points, and a brand that finished flat has had a genuinely strong twelve months.

Because this is a June-to-June comparison, none of the movement is seasonal. It is the same fortnight of the booking calendar in both readings.

Two domains were removed before any of this analysis ran. A decline that deep alongside a rank fall that large is what domain retirement or de-indexation looks like, so neither is treated as a change in demand, and both are excluded from every other figure on this page.


Domain Jun 2025 Jun 2026 Change Rank movement
holidaylettings.co.uk 97,643 7,031 -92.80% 15 → 97 (-82)
2cholidays.co.uk 28,988 2,996 -89.66% Fell to 132, outside top 100

sykescottages.co.uk finished the year as the largest single domain in the published table at 380,736 monthly visits, up from 371,352. Behind it, the ordering changed substantially. independentcottages.co.uk climbed from rank 12 to rank 5, holidu.co.uk climbed 37 places from rank 43 to rank 6, and historic-uk.com moved from rank 28 to rank 14. The largest fall inside the top ten went to holidaycottages.co.uk, which dropped seven places from rank 2 to rank 9 and lost 229,009 monthly visits.

The upward movers cluster around two page types. Aggregators and directories with deep county-level and property-type category pages gained ground, while brands whose visibility concentrates on the homepage and a small set of brand-adjacent landing pages lost it. plumguide.com, groupaccommodation.com, farmstay.co.uk and marsdens.co.uk all rank on non-branded queries through category pages rather than through brand recognition, and all four grew.

holidu.co.uk went from 33,136 to 151,595 monthly visits, +357.49%, the largest single share shift in the table. It has 2,900 monthly branded searches and a 4.3-star review average, so very few people are typing that name into Google. They are arriving on town, region and coastal-strip pages that did not exist twelve months earlier. hometogo.co.uk runs the same metasearch model and fell 32.80%, losing 26,385 monthly visits, so this is one company expanding its indexed page count rather than evidence about aggregation as a model.


Domain Rank Jun 2025 Rank Jun 2026 Places
holidu.co.uk 43 6 +37
boltholesandhideaways.co.uk 115 84 +31
marsdens.co.uk 68 38 +30
plumguide.com 56 30 +26
farmstay.co.uk 65 39 +26
historic-uk.com 28 14 +14
independentcottages.co.uk 12 5 +7
holidaycottages.co.uk 2 9 -7
big-cottages.com 34 51 -17
cornishsecrets.co.uk 35 58 -23


Sorted by percentage growth, the market’s strongest performers look like sowerbysholidaycottages.co.uk at +80.52%, boltholesandhideaways.co.uk at +73.49% and fineststays.co.uk at +70.41%. Sorted by monthly visits actually added, those three gained 2,939, 3,806 and 4,712 respectively, from starting figures of 3,650, 5,179 and 6,692. All three had a good year, and all three are small enough that a handful of newly ranking category pages produces a headline percentage.

Switching the sort to absolute change surfaces a performance the percentage column hides. sykescottages.co.uk grew 2.53%, which reads as a rounding error on a chart of percentages, and added 9,384 monthly visits, the tenth largest absolute gain in the whole market. Against a market that fell 19.00%, that is +21.53 percentage points versus market, the strongest relative performance of any brand at the top of the table.

Reading absolute change also identifies brands whose modest percentage decline conceals a large loss in visits. lastminute-cottages.co.uk reports -10.90% and a flattering +8.10 percentage points versus market, while losing 24,752 monthly visits, a larger absolute loss than big-cottages.com sustained while falling 48.37%. simplyseaviews.co.uk (-13.14%, -10,806 visits) and hottubhideaways.com (-8.54%, -13,263 visits) show the same gap at smaller scale. Any brand whose board pack reports percentage change and a versus-market column without absolute change will read three of those four as a solid year.


Domain % change Monthly visits moved Vs -19.00% market
sowerbysholidaycottages.co.uk +80.52% +2,939 +99.52%
boltholesandhideaways.co.uk +73.49% +3,806 +92.49%
fineststays.co.uk +70.41% +4,712 +89.41%
sykescottages.co.uk +2.53% +9,384 +21.53%
hottubhideaways.com -8.54% -13,263 +10.46%
lastminute-cottages.co.uk -10.90% -24,752 +8.10%
simplyseaviews.co.uk -13.14% -10,806 +5.86%
big-cottages.com -48.37% -24,147 -29.37%

The ten brands with the highest Brand Reach Score averaged -28.17% year on year. The ten with the lowest averaged +7.27%. That is a 35.44 percentage point gap inside one market over one twelve-month window, and only 3 of the top ten beat the market while 8 of the bottom ten did.

The eight declining brands inside the top-ten Brand Reach cohort lost 1,047,668 monthly visits between them, while the full cohort still attracts 1,404,800 branded searches a month. People are still typing these brand names into Google in very large numbers. Fewer of those searches finish as a session on the brand’s own website.

Branded and navigational queries are the ones most exposed to what has changed on the results page. A brand name plus a county is now routinely answered inside an AI Overview, a map pack or a comparison panel, and it is the same query an aggregator such as holidu.co.uk or independentcottages.co.uk can outrank a brand on. Non-branded queries with clear click intent, such as dog friendly cottages in north Norfolk or cottages with hot tubs in the Peak District, still send users through to someone’s category page, and the brands that grew have a category page built for each of those.

Brand size on its own is a weak predictor here. sykescottages.co.uk grew 2.53% on 246,000 monthly branded searches, and centerparcs.eu fell 7.71% on the same volume, so two of the three largest branded-search names in this market beat the -19.00% average.


Brand Branded searches/mo YoY visibility Vs -19.00% market
Top 10 by Brand Reach 1,404,800 combined -28.17% -9.17%
Bottom 10 by Brand Reach +7.27% +26.27%
sykescottages.co.uk 246,000 +2.53% +21.53%
centerparcs.eu 246,000 -7.71% +11.29%
holidu.co.uk 2,900 +357.49% +376.49%
marsdens.co.uk 10 +77.61% +96.61%


Brand leaders who loved our reports

"I am massively grateful for this report and there aren't many other useful ones I have found for online flower services."

"Really impressed with the work done behind the research, really well done to the team and Salience"

"The report it was very interesting as has been the case in previous years."

Yes. We give them away because the only thing we need from you is your email. No payment, no credit card, no catch.

We refresh every report twice a year. The 2026 Holiday Cottages Index uses data collected in June 2026, for the period June 2025-June 2026.

Unfortunately, due to the nature of the beast, we cannot gather data for every single website that ranks for a holiday cottages keyword and considers itself a holiday cottages brand. We rank the 100 largest by organic visibility in the UK. However, if yours isn’t there, we’re more than happy to gather some data for you using the full range of tools at our disposal. If you’d like custom data, get in touch.

Request custom data

No. We are committed to making this report the single best free asset for in-house holiday cottages marketers. Our sector reports are far removed from a lead magnet. That said, it’s impossible for us to share all the insights that can be gleaned from the data in the PDF alone. We will follow up with additional analysis, written by us, sharing our thoughts on the data based on our 15 years of experience as the search agency behind some of the UK’s biggest brands. This often includes analysis of where search marketing is going within the industry and brand spotlights, where we break down why we think certain brands are doing well. We maintain that you can unsubscribe from this additional content if you wish. It will never be a sales push, only ever added value.

Yes. We spend tens of thousands of pounds a year on top-of-the-line software, tools and proprietary systems that we have at our fingertips, and are more than happy to help you with your data needs. Get in touch with a brief.

Request custom data

Still scrolling? Here's the full 69-page report.

Download the free report
Rustic wooden cabin in a mountainous landscape, surrounded by wildflowers and pine trees.