Need more value from search? Book a free discovery call 📞
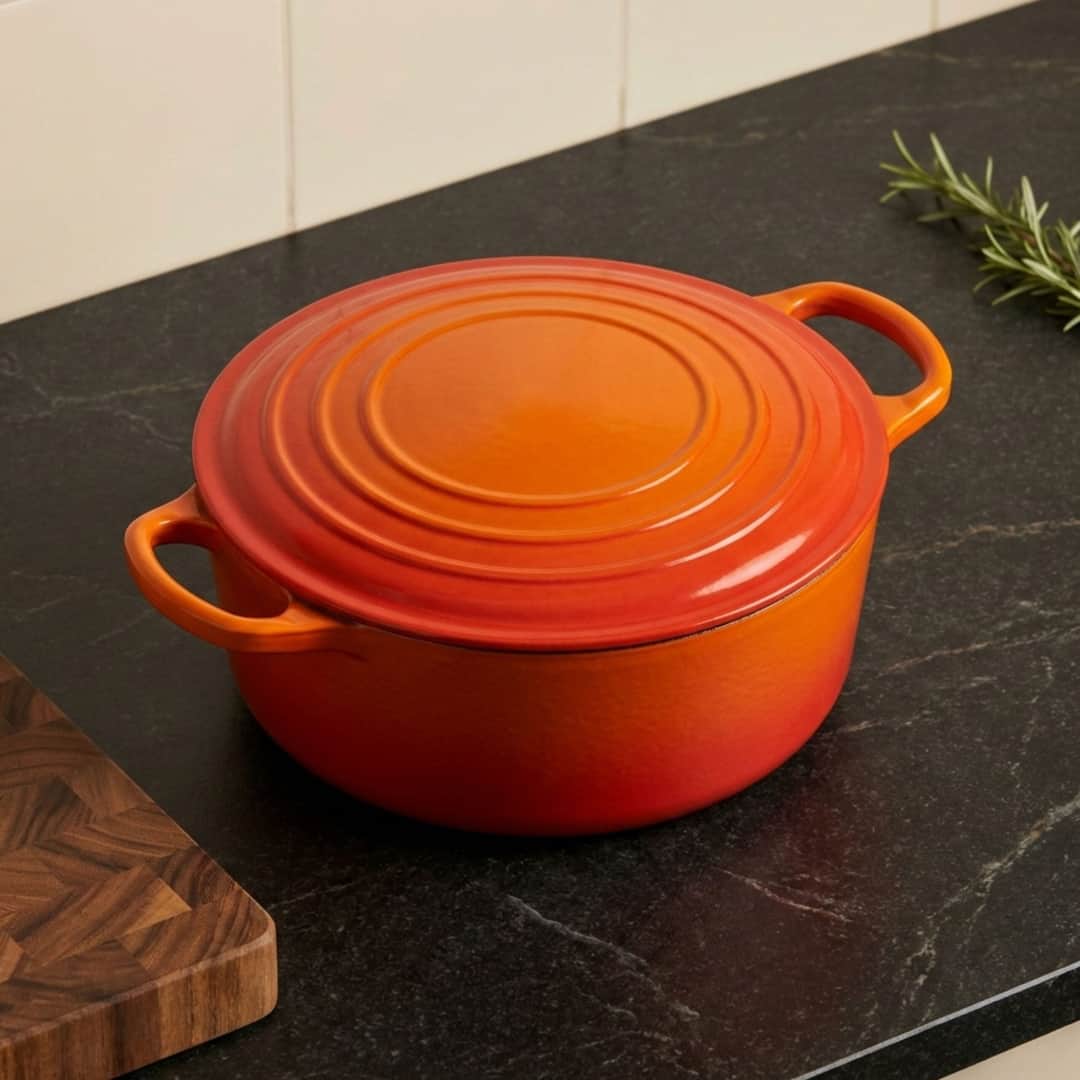
Orange enamel Dutch oven on black granite kitchen counter.
UPDATED OCT 2026
100+

Brands Ranked

69

Pages

9,800

Keywords

10

Min Read

100+ Brands Featured

Emma Bridgewater logo on Salience marketing agency blog post #3883
Logo of Joseph Joseph in bold navy blue text on a white background.
Ooni logo in navy, featured on Salience's digital marketing agency page post #3883.
Tefal logo in dark blue with registered trademark symbol
Dualit logo in dark blue text on a transparent background
+116%

Biggest traffic gain

+33%

Appliance growth

-20%

Retailer decline

Our reports have been the UK’s No.1 search marketing benchmark for the last 10 years! Marketing decision makers spanning 60 sectors have downloaded our reports to save over 72 hours of research and discover exactly how their brand ranks against the competition in search, visibility, and growth potential.

I was extremely impressed with the insight and depth of analysis in the Salience Report... The data-driven analysis tracking visibility, authority, links, page speed, search volume, keywords, and more paints a detailed picture of brand performance and emerging trends. The team was delighted to be featured.

The Salience Kitchenware Index

The UK's No.1 Kitchenware Industry Report

FREE
DOWNLOAD

Kitchenware Industry Analysis

Kitchenware Industry Analysis

The Salience Index ranks more than 100 UK kitchenware brands and retailers on organic search, brand awareness and social, and this edition compares August 2026 with August 2025. The largest single move across those twelve months came from Tefal, whose online shop grew estimated monthly search traffic 116% and more than doubled in a year.

Growth went to the companies that make the appliances. Kitchen appliance manufacturers grew their estimated search traffic by about a third over the year, while retailers stocking many brands lost about a fifth of theirs. Manufacturer sites are now answering the product searches that used to send shoppers to cookshops and multi-brand homeware retailers.

Demand inside the category moved as well. Milk frothers draw 48,000 UK searches a month, more than twice the monthly volume for cutlery. Coffee preparation is now one of the larger pockets of searchable demand in kitchenware, and several long-standing staple categories sit well below it on volume.

Lakeland remains the most-searched name in UK kitchenware at 246,000 brand searches a month. The report sets brand-search volume against estimated organic traffic for every brand tracked, so you can see how much of a brand’s visibility comes from people searching its name and how much comes from its pages ranking for the products it sells.

The biggest movement this year came from the companies that make the appliances. Tefal, Smeg, Salter and Morphy Richards each grew their own site’s estimated search traffic by more than a quarter in the twelve months to August 2026, and Tefal’s online shop grew 116%.

Smeg is the one to look at closely. Its estimated search traffic grew 56% year on year while searches for the Smeg name fell 14%. The growth came through non-branded product searches, with shoppers landing on product detail pages for terms such as coffee machine and toaster while fewer people typed the brand name into Google.

Retailers stocking many brands lost about a fifth of their estimated search traffic over the same twelve months. When a manufacturer’s product detail pages rank for the product terms, the retailer’s category pages for those same terms sit lower on the SERP and take fewer visits.

For a retailer, the usual answer is content a manufacturer has no reason to build: comparison pages across several brands, buying guides, review content, and internal linking from those pages into the category pages that carry the commercial terms. For a manufacturer, the open question is whether this growth holds while brand search is flat or falling, as it is at Smeg.


Measure Aug 2025 to Aug 2026
Tefal online shop, estimated search traffic +116%
Smeg, estimated search traffic +56%
Smeg, brand searches -14%
Kitchen appliance makers, estimated search traffic Up about a third
Multi-brand retailers, estimated search traffic Down about a fifth

The report is built for marketing and ecommerce teams at kitchenware brands, appliance manufacturers, cookshops and homeware retailers, and the movement in search terms is the part most teams act on first.

Colour-led searches receded this year. “sage green kitchenware” and “black kitchenware” both fell sharply. Teams that built collection pages around colour through 2024 and 2025 are now holding rankings for terms with shrinking volume behind them. Searches for a coloured kettle and toaster held steady, so colour still earns a page at product level, where someone is matching one appliance to a kitchen they already have.

Coffee equipment grew while the wider kitchenware market shrank. “milk foam machine” rose 64% in the twelve months to July 2026, and milk frothers now take 48,000 UK searches a month, more than twice the volume behind cutlery.

If you own search, brand or digital PR for a kitchen business, the practical use of the report is to check your position against the brands you compete with, then check which of your category pages and product detail pages sit against rising volume and which sit against falling volume. The emerging and receding term lists carry the monthly volumes, so you can size that work before you rebuild a single page.

Every brand in the index gets a full row: estimated monthly search traffic, the change across the twelve months to August 2026, and a rank that places it against the rest of the category.

Alongside traffic, the report carries domain authority, referring domain counts and page speed, each set against estimated traffic. Reading those columns together shows which brands rank higher than their link profile alone would support, usually through content depth, internal linking and schema markup, and which brands hold authority they have yet to turn into visits.

The emerging and receding product and brand searches are listed with their monthly volumes, so you can see where demand is moving before you commit a quarter of content resource to it. High competition and opportunity keywords for kitchenware are separated out, which matters when you are deciding whether to compete for a head term or build around the longer product searches that convert.

Brand awareness combines online review volume, owned social score and brand search volume into one ranking, and Lakeland leads it at 246,000 brand searches a month. Reading that ranking next to the organic traffic ranking is the quickest way to see whether people arrive at your site because they already know the name or because your pages rank for the products you sell.

The report covers more than 100 UK kitchenware brands and retailers, and it is free to download.
Brand leaders who loved our reports

"I am massively grateful for this report and there aren't many other useful ones I have found for online flower services."

"Really impressed with the work done behind the research, really well done to the team and Salience"

"The report it was very interesting as has been the case in previous years."

Kitchenware Report FAQs

Kitchenware Report FAQs

Yes. We give them away because the only thing we need from you is your email. No payment, no credit card, no catch.

We refresh every report twice a year. The 2026 Online Kitchenware Index uses data collected in August 2026, for the period Aug 2025-Aug 2026.

Unfortunately, due to the nature of the beast, we cannot gather data for every single website that ranks for a kitchenware keyword and considers itself a kitchenware brand. We rank the 100 largest by organic visibility in the UK. However, if yours isn’t there, we’re more than happy to gather some data for you using the full range of tools at our disposal. If you’d like custom data, get in touch.

Request custom data

No. We are committed to making this report the single best free asset for in-house kitchenware marketers. Our sector reports are far removed from a lead magnet. That said, it’s impossible for us to share all the insights that can be gleaned from the data in the PDF alone. We will follow up with additional analysis, written by us, sharing our thoughts on the data based on our 15 years of experience as the search agency behind some of the UK’s biggest brands. This often includes analysis of where search marketing is going within the industry and brand spotlights, where we break down why we think certain brands are doing well. We maintain that you can unsubscribe from this additional content if you wish. It will never be a sales push, only ever added value.

Yes. We spend tens of thousands of pounds a year on top-of-the-line software, tools and proprietary systems that we have at our fingertips, and are more than happy to help you with your data needs. Get in touch with a brief.

Request custom data

Still scrolling? Here's the full 69-page report.

Download the free report
Orange enamel Dutch oven on black granite kitchen counter.