Improving pagespeed has always been a crucial component for SEO, but lately it’s been in the news more than usual following the recent algorithm changes.
Now that the dust has settled on this Google update, is your site as fast as it should be?
Speed is a ranking factor
Website speed has been a ranking factor for years. However, in July 2018, a new Speed Update algorithm incorporated speed as a search ranking factor to the mobile search results:

On the update, Google said the following:
‘Although speed has been used in ranking for some time, that signal was focused on desktop searches. Today we’re announcing that starting in July 2018, page speed will be a ranking factor for mobile searches.’
With speed now a crucial ranking factor in the Mobile First Index, it rests with webmasters to ensure their site speed is as fast as possible.
Update May 2020: The need for speed is about to be even more important. Google has announced the Core Web Vitals; essentially testing a webpage’s ability to offer a great user experience, which includes the loading time of a page and other signals. The Core Web Vitals of a page are already being measured (you can now spot them in the results of Google’s Pagespeed Insights tool and in the reports of Search Console) and will be incorporated into an upcoming Page Experience algorithm update, expected in 2021.
Related: Mobile-First Index: What It Is & How Not To Be Affected
Small load time equals big business
Ranking signals are not the only reason to focus your efforts on improving pagespeed.
Amazon calculated that a page load slowdown of just one second could cost it $1.6 billion in sales each year, and a Radware study showed an 8.3% increase in bounce rate and 9.4% decrease in page views for an increase of 1-second to a page load time.
A further Radware study from 2015 reported that for every one second of improvement, Walmart.com experienced up to a 2% conversion increase.
Web browser Firefox reduced their average page load time by 2.2 seconds, which amplified downloads by 15.4%. This then resulted in an estimated 10 million additional downloads per year.
Lastly, AutoAnything.com cut load times in half and experienced a 13% increase in sales.
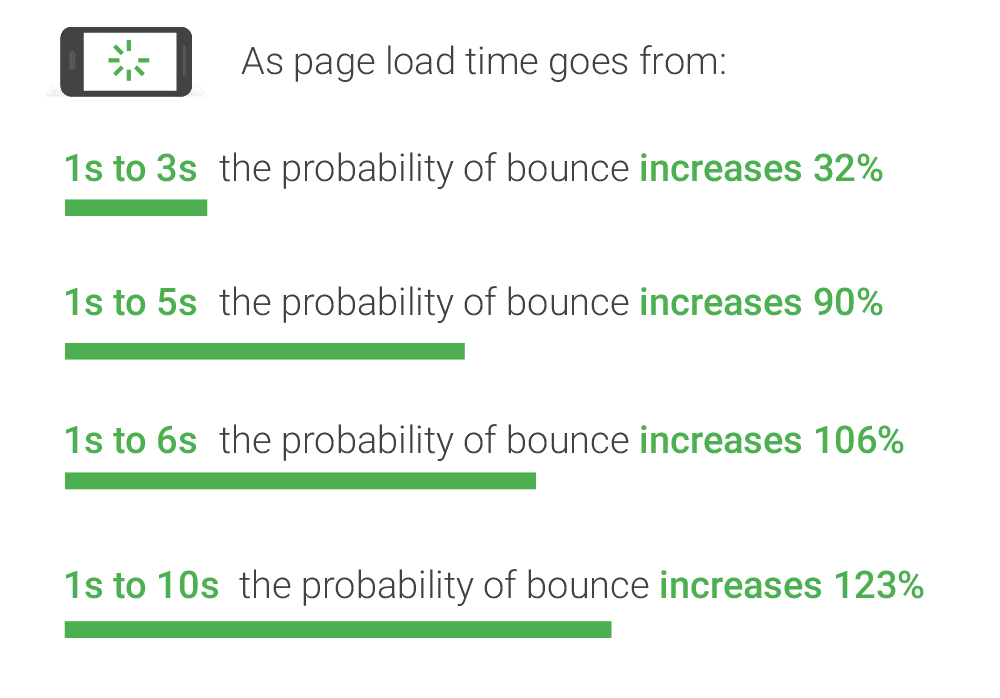
Think With Google released the below data which shows just how much engagement can change with increasing page load time:
They also shared further mobile speed test data:
- 53% of mobile users will leave a page if it takes 3 seconds or more to load.
- The average load time for a mobile website in 2018 is 15 seconds. That’s 7 seconds faster than in 2017.
- 70% of the mobile landing pages analysed took more than 5 seconds for the visual content to display.
- 53% of mobile URLs are larger than 2 MB.
Ensuring your pagespeed is as fast as possible has never been more important. But how can you measure it? And, crucially, how can you improve it?
Measuring pagespeed
When you want to check website speed, it is important to get as much data and as many opinions as possible, as figures can often fluctuate between each website speed test.
There is, of course, the Google recommended Pagespeed Insights tool, but why stop there? We suggest looking at additional third-party platforms for a more well-rounded data set.
Below we will go through and discuss some distinctions and benefits of three platforms we recommend; Google Pagespeed Insights, GT Metrix and Pingdom.
Google Pagespeed Insights
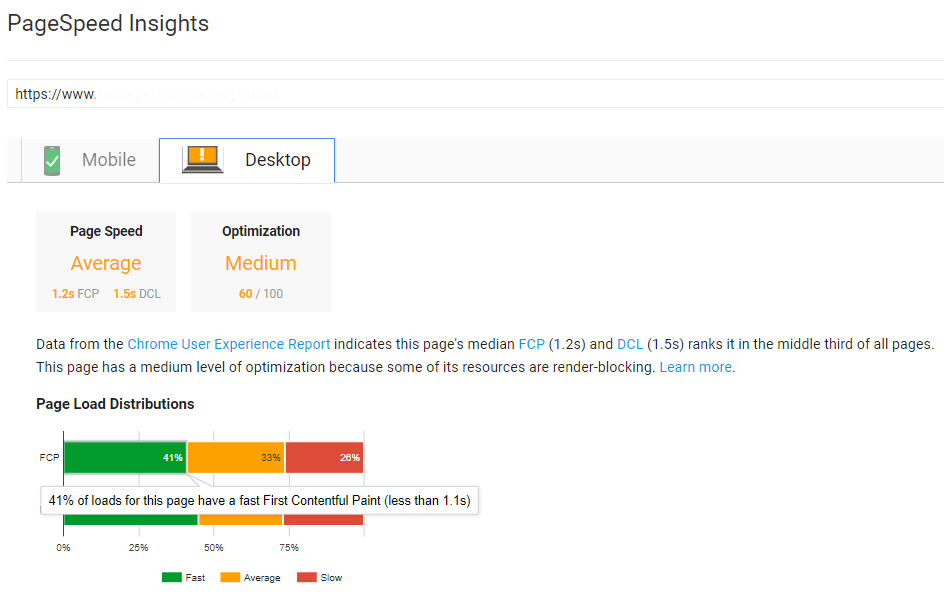
The Google Pagespeed Insights Tool is probably the most recognised page speed test tool. Google calculates their pagespeed score by ‘incorporating data from the Chrome User Experience Report (CrUX) to display real-world performance data about a page’.
As for the Optimisation Score, PageSpeed Insights ‘evaluates how well a page follows common performance best practices and computes a score from 0-100 that estimates its performance headroom’.
As a result, PageSpeed Insights can show easy-to-understand data for assessing the page load speed of your website:
Not only that, but PageSpeed Insights also shows clear suggestions and fixes for you to improve your page speed and Optimization score:
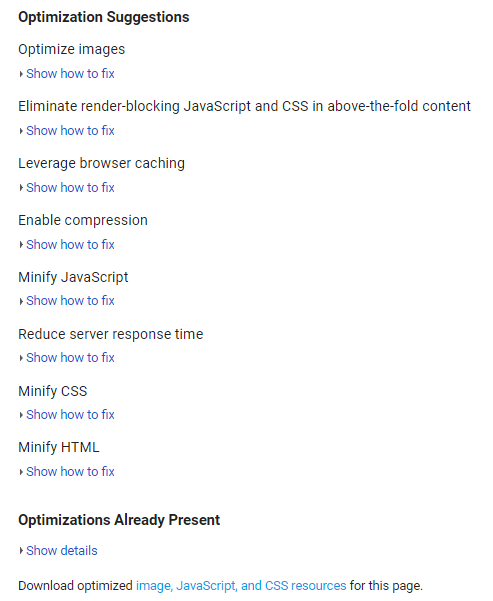
The straightforward user interface, clear recommendations and Google affiliation make the PageSpeed Insights tool a clear first stop for assessing pagespeed.
However, as discussed above, limiting yourself to one site speed test platform will hinder your data and opportunities to improve.
Related: Old vs. New Google PageSpeed Insights – Putting it to the Test
GT Metrix
GT Metrix is the first of our additional platforms we suggest looking at. It neatly calculates your pagespeed performance based off several key indicators of page load speed and analyses your page with Google PageSpeed and Yahoo! YSlow rulesets which shows data on Page Load Time, Total Page Size and Total Number of Requests:
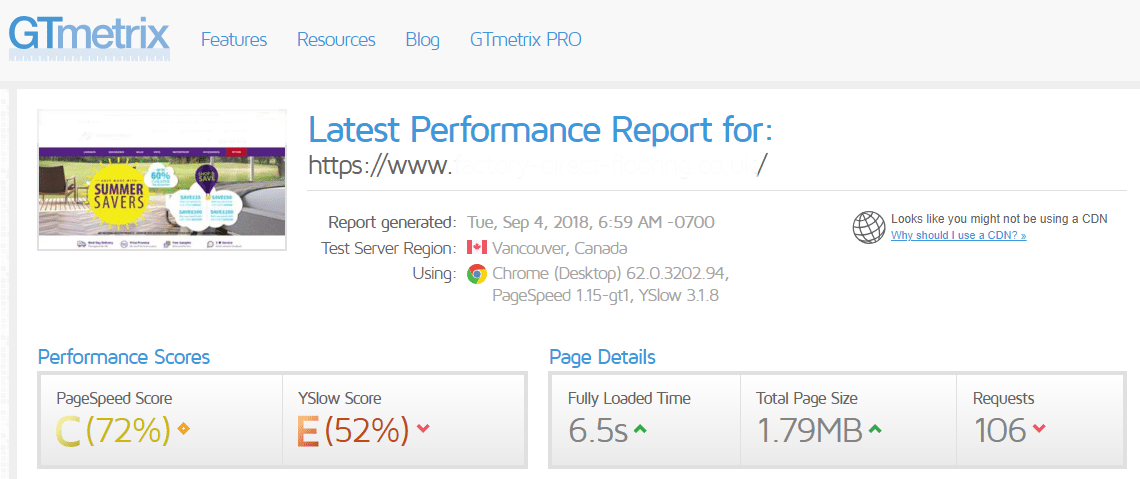
GT Metrix also offers significantly more data at your speed assessing fingertips than PageSpeed Insights.
The Waterfall data, for example, displays the request-by-request loading behaviour of your website. This shows every script, media file, and/or third-party resource your page requests:
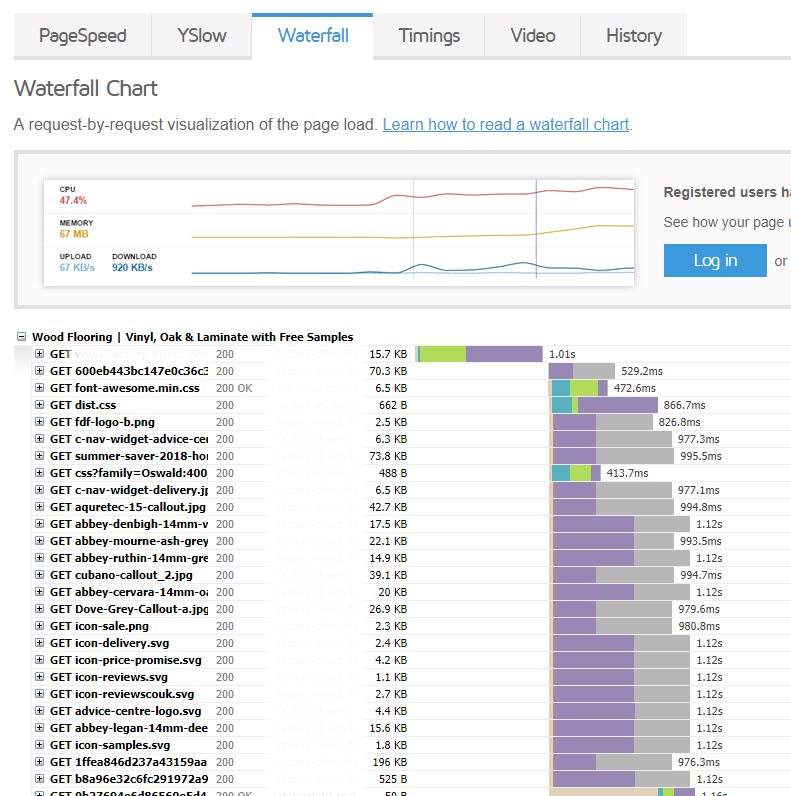
This additional area to consider is a neat example of why more data on our web speed test can lead to more optimisation opportunities.
Pingdom
Pingdom is next and uses more than 70 global polling locations to test and verify website speeds. The tool shows page size, no. of requests and relates your sites speed against other Pingdom tests, giving you an insightful comparison score from across several websites:

It also allows you to save each test, so you can review how your score has changed once recommendations have been implemented.
Pingdom offers similar performance insights to PageSpeed Insights and GT Metrix, but also breaks down the data with content size by type or domain and requests by content type or domain:
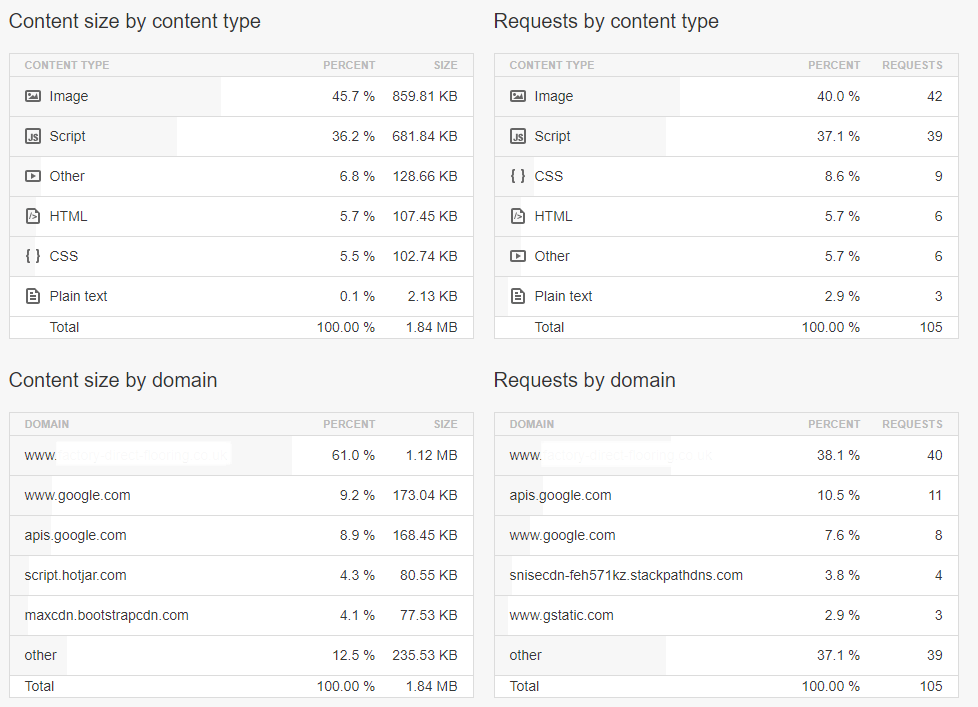
This can help you quickly identify which resources are affecting pagespeed the most and which external domains could be dragging the score down.
